In the rapidly evolving digital landscape, monitoring real-time data and managing events are crucial for maintaining robust and reliable applications. As more organizations migrate their operations to the cloud, the need to efficiently monitor cloud events and change data has never been greater. There are many APM tools available on the market such as Datadog, AppDynamics, Dynatrace, and more. New Relic, a premier observability platform, provides strong tools for gathering actionable insights and ensuring system reliability.
Most application outages are caused by changes or updates. Monitoring teams often struggle to determine the cause of an outage due to scattered data across different platforms and the need to track changes in various locations. This increases the Mean Time To Recover (MTTR). New Relic contains application-related data such as logs, CPU usage and etc. However, it doesn't currently include cloud events and changes. If these were integrated into New Relic, the monitoring team could more easily identify the root cause of outages. To resolve this, we need to consolidate all data into a single pane for easy monitoring.
In this blog article, we'll look at how to effortlessly integrate cloud events and change data into New Relic, giving your team greater visibility and control over your cloud architecture.
Let's connect with Onepane
To connect New Relic with OnePane, you will need your New Relic Account ID, API key, and Ingest License. Follow the below steps to connect newrecli to Onepane
Step 1: Login to Onepane with your credentials. You can log in using your Google or Microsoft account.
Step 2: Follow the link to integrate Newrelic with OnePane.
Next let install the Dashboard to new relic account, go to Onepane Newrelic
Step 3: Follow the link https://newrelic.com/instant-observability/onepane and click install button.
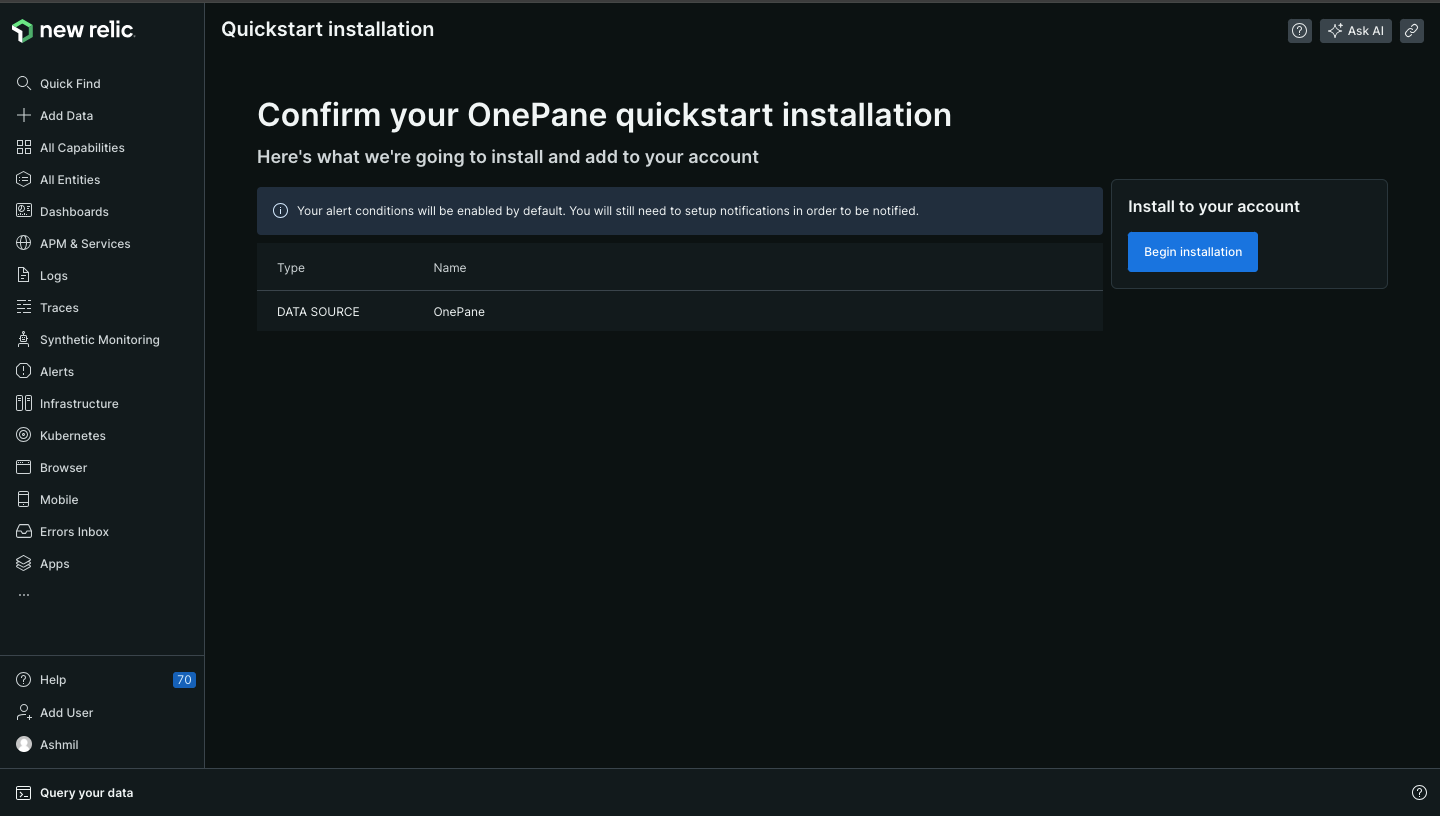
Step 4. After clicking install button you will get a confirmation page like below, click on “Begin installation”.
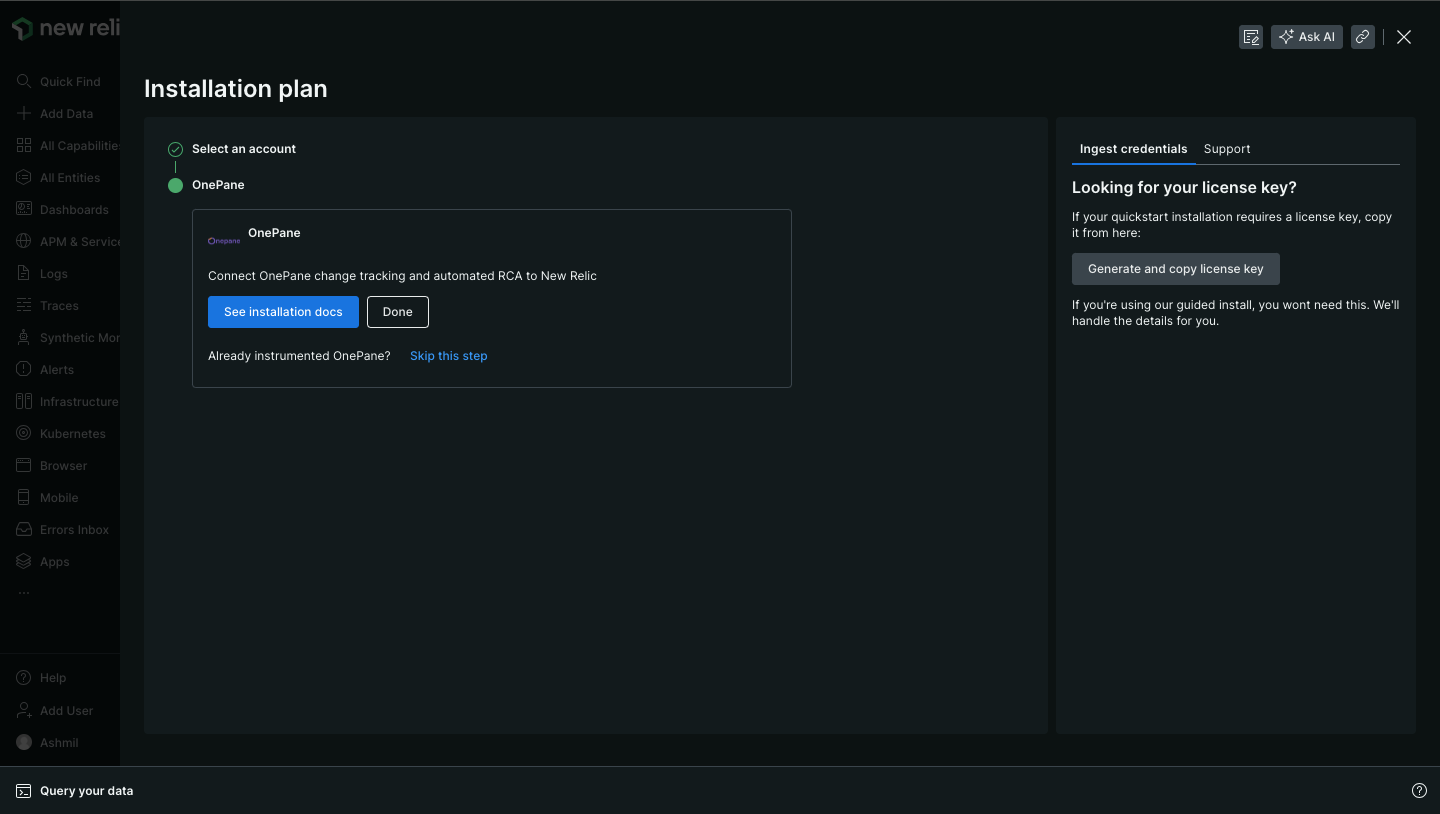
Step 5. We already connect Newrelic to Onepane, so click on "Done" button.
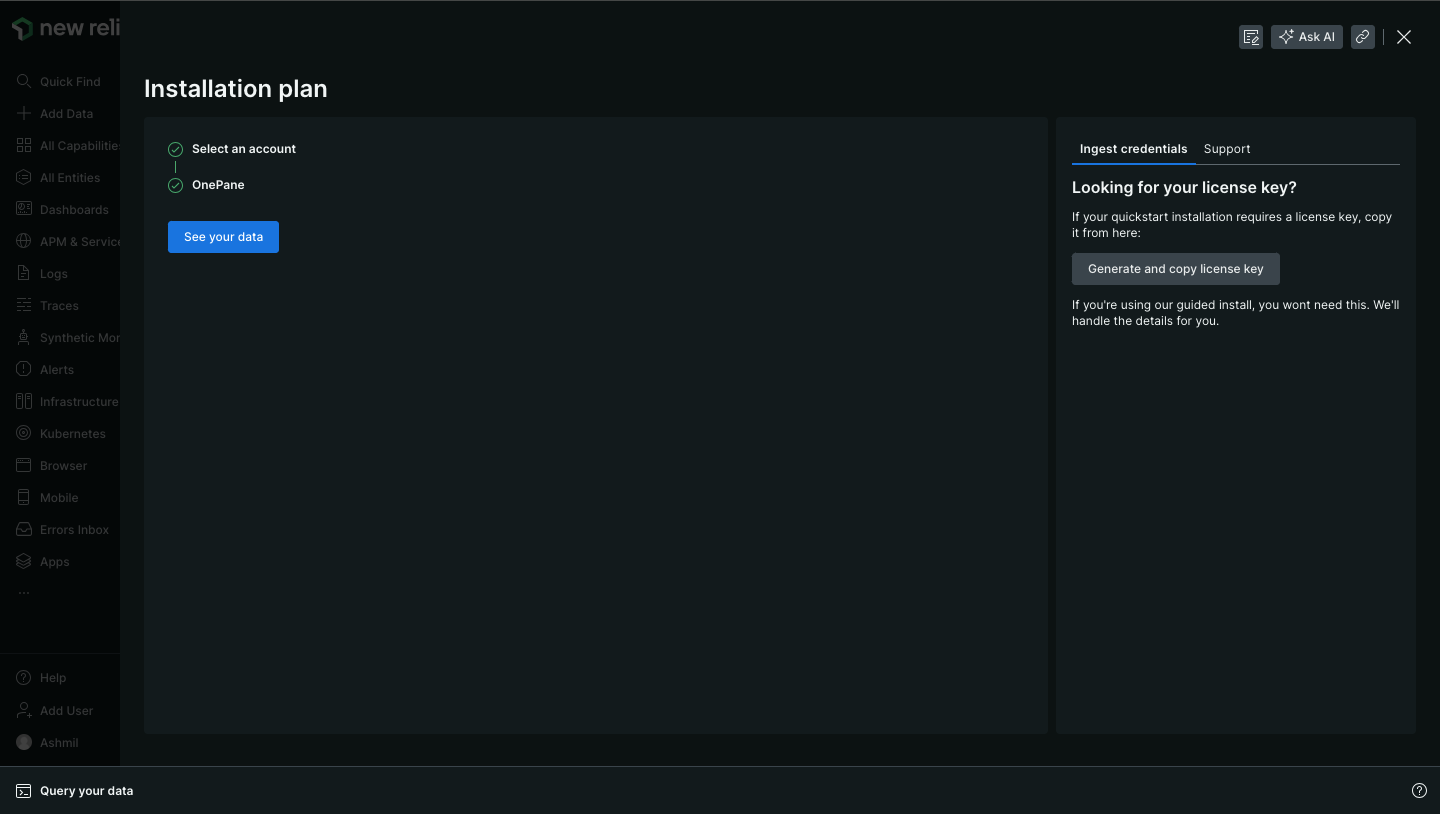
Step 6. Click on "See your data" button to bring data from Onepane platform.
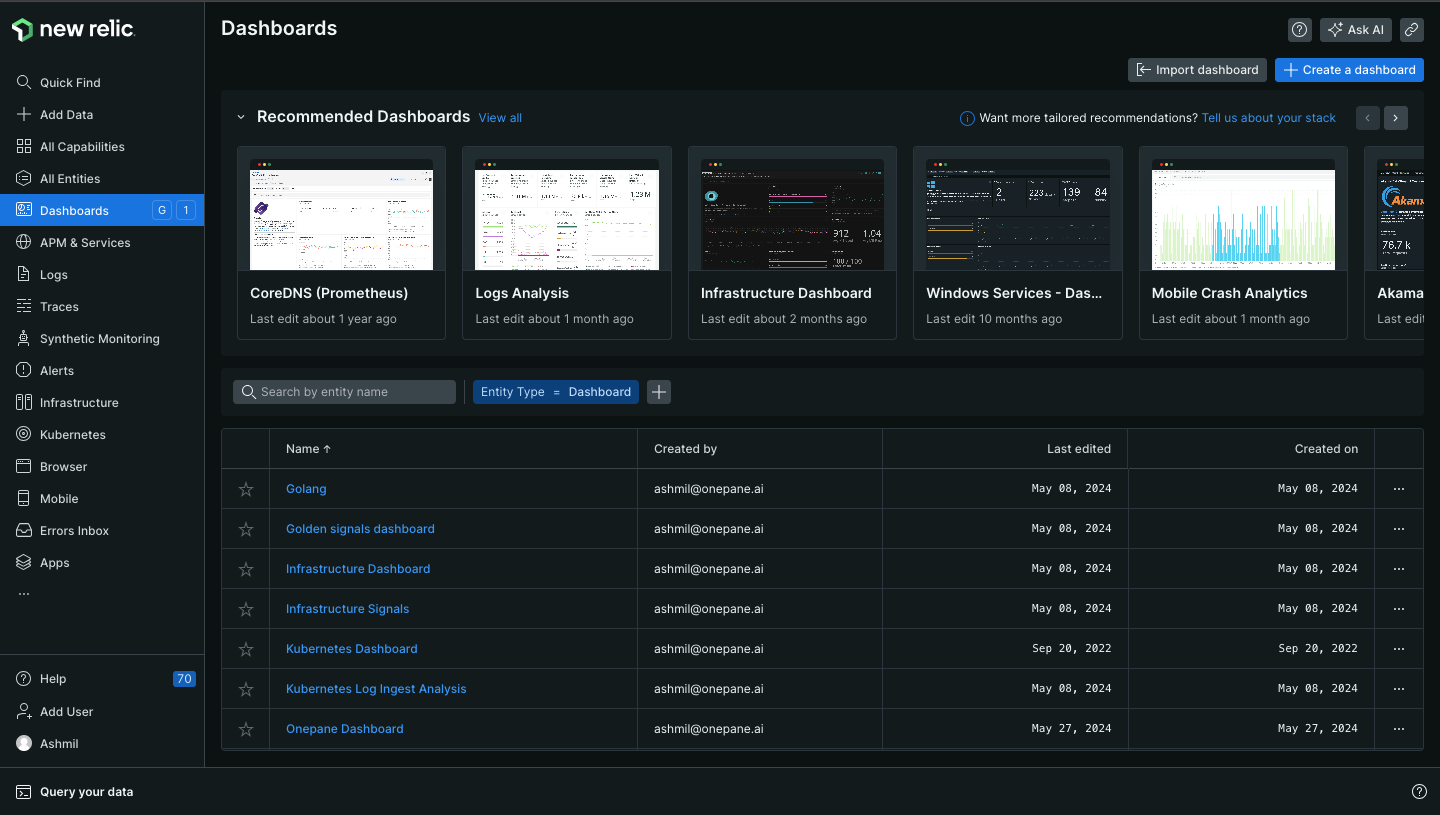
Step 7: Click on Dashboard menu on the side menu, which list all available dashboard, click on "Onepane Dashboard".
Finally, you will see a dashboard similar to the one shown below
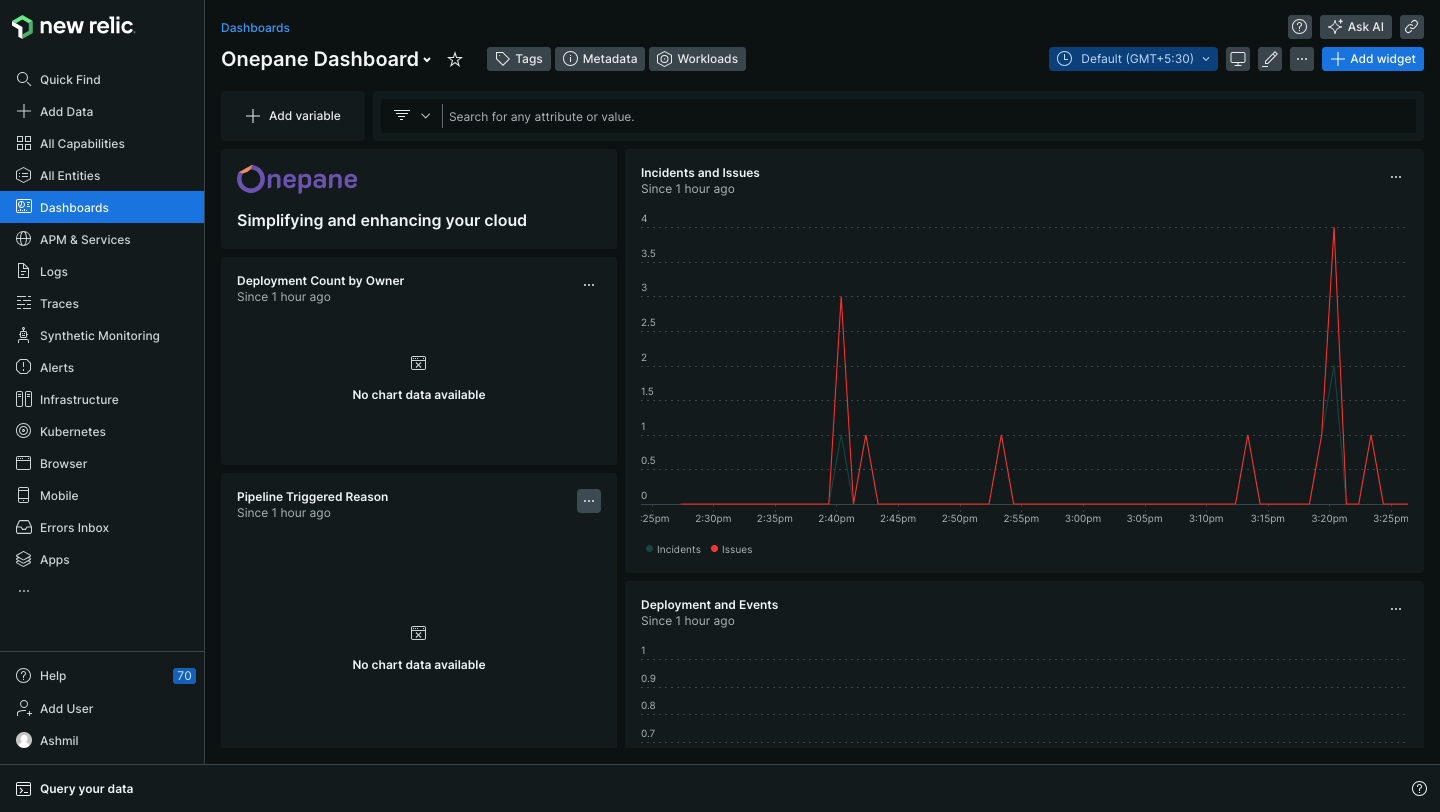
After integrating OnePane Dashboard into New Relic, you will gain access to additional metrics from the OnePane platform. These metrics include metrics such as 'Deployment Count by Owner', 'Incidents and Issues', and 'Deployments and Events', which will be displayed on the dashboard.