
We already discussed two methods to deploy Prometheus using Kubernetes Operator. Prometheus doesn't have an inbuilt visualization capability so it will be using Grafana for visualization. This blog discusses how to deploy Prometheus with helm.
Deploy Prometheus on Kubernetes with Helm 3
Step 1 : Create a namespace
Create a namespace named 'monitoring' for deploying promethus
kubectl create ns monitoringStep 2: Install using Helm
We are using helm chart by Bitnami for this tutorial find the actual repo URL here Bitnami documentation
Add helm repo to local
helm repo add bitnami Install Prometheus in the 'monitoring' namespace helm
helm install prometheus bitnami/kube-prometheus --namespace monitoring --create-namespaceThis helm deployment comes with a Grafana. so you can simply port-forward it and access Grafana locally.
kubectl port-forward svc/grafana 3000 --namespace monitoringalso, port-forward Prometheus to connect Grafana to Prometheus, then only Grafana can pull the data.
kubectl port-forward svc/prometheus-k8s 9090 --namespace monitoringnow we can access Grafana and Prometheus locally from 3000 and 9090 ports. Grafana's default username and password is admin. login to Grafana by following the URL
http://localhost:3000/to communicate Grafana and Prometheus there should be a connection alive, so we need to add a Prometheus connection in Grafana. By default there will be a connection because we deployed both Grafana and Prometheus together, if it's not there we can add a new connection by following the steps.
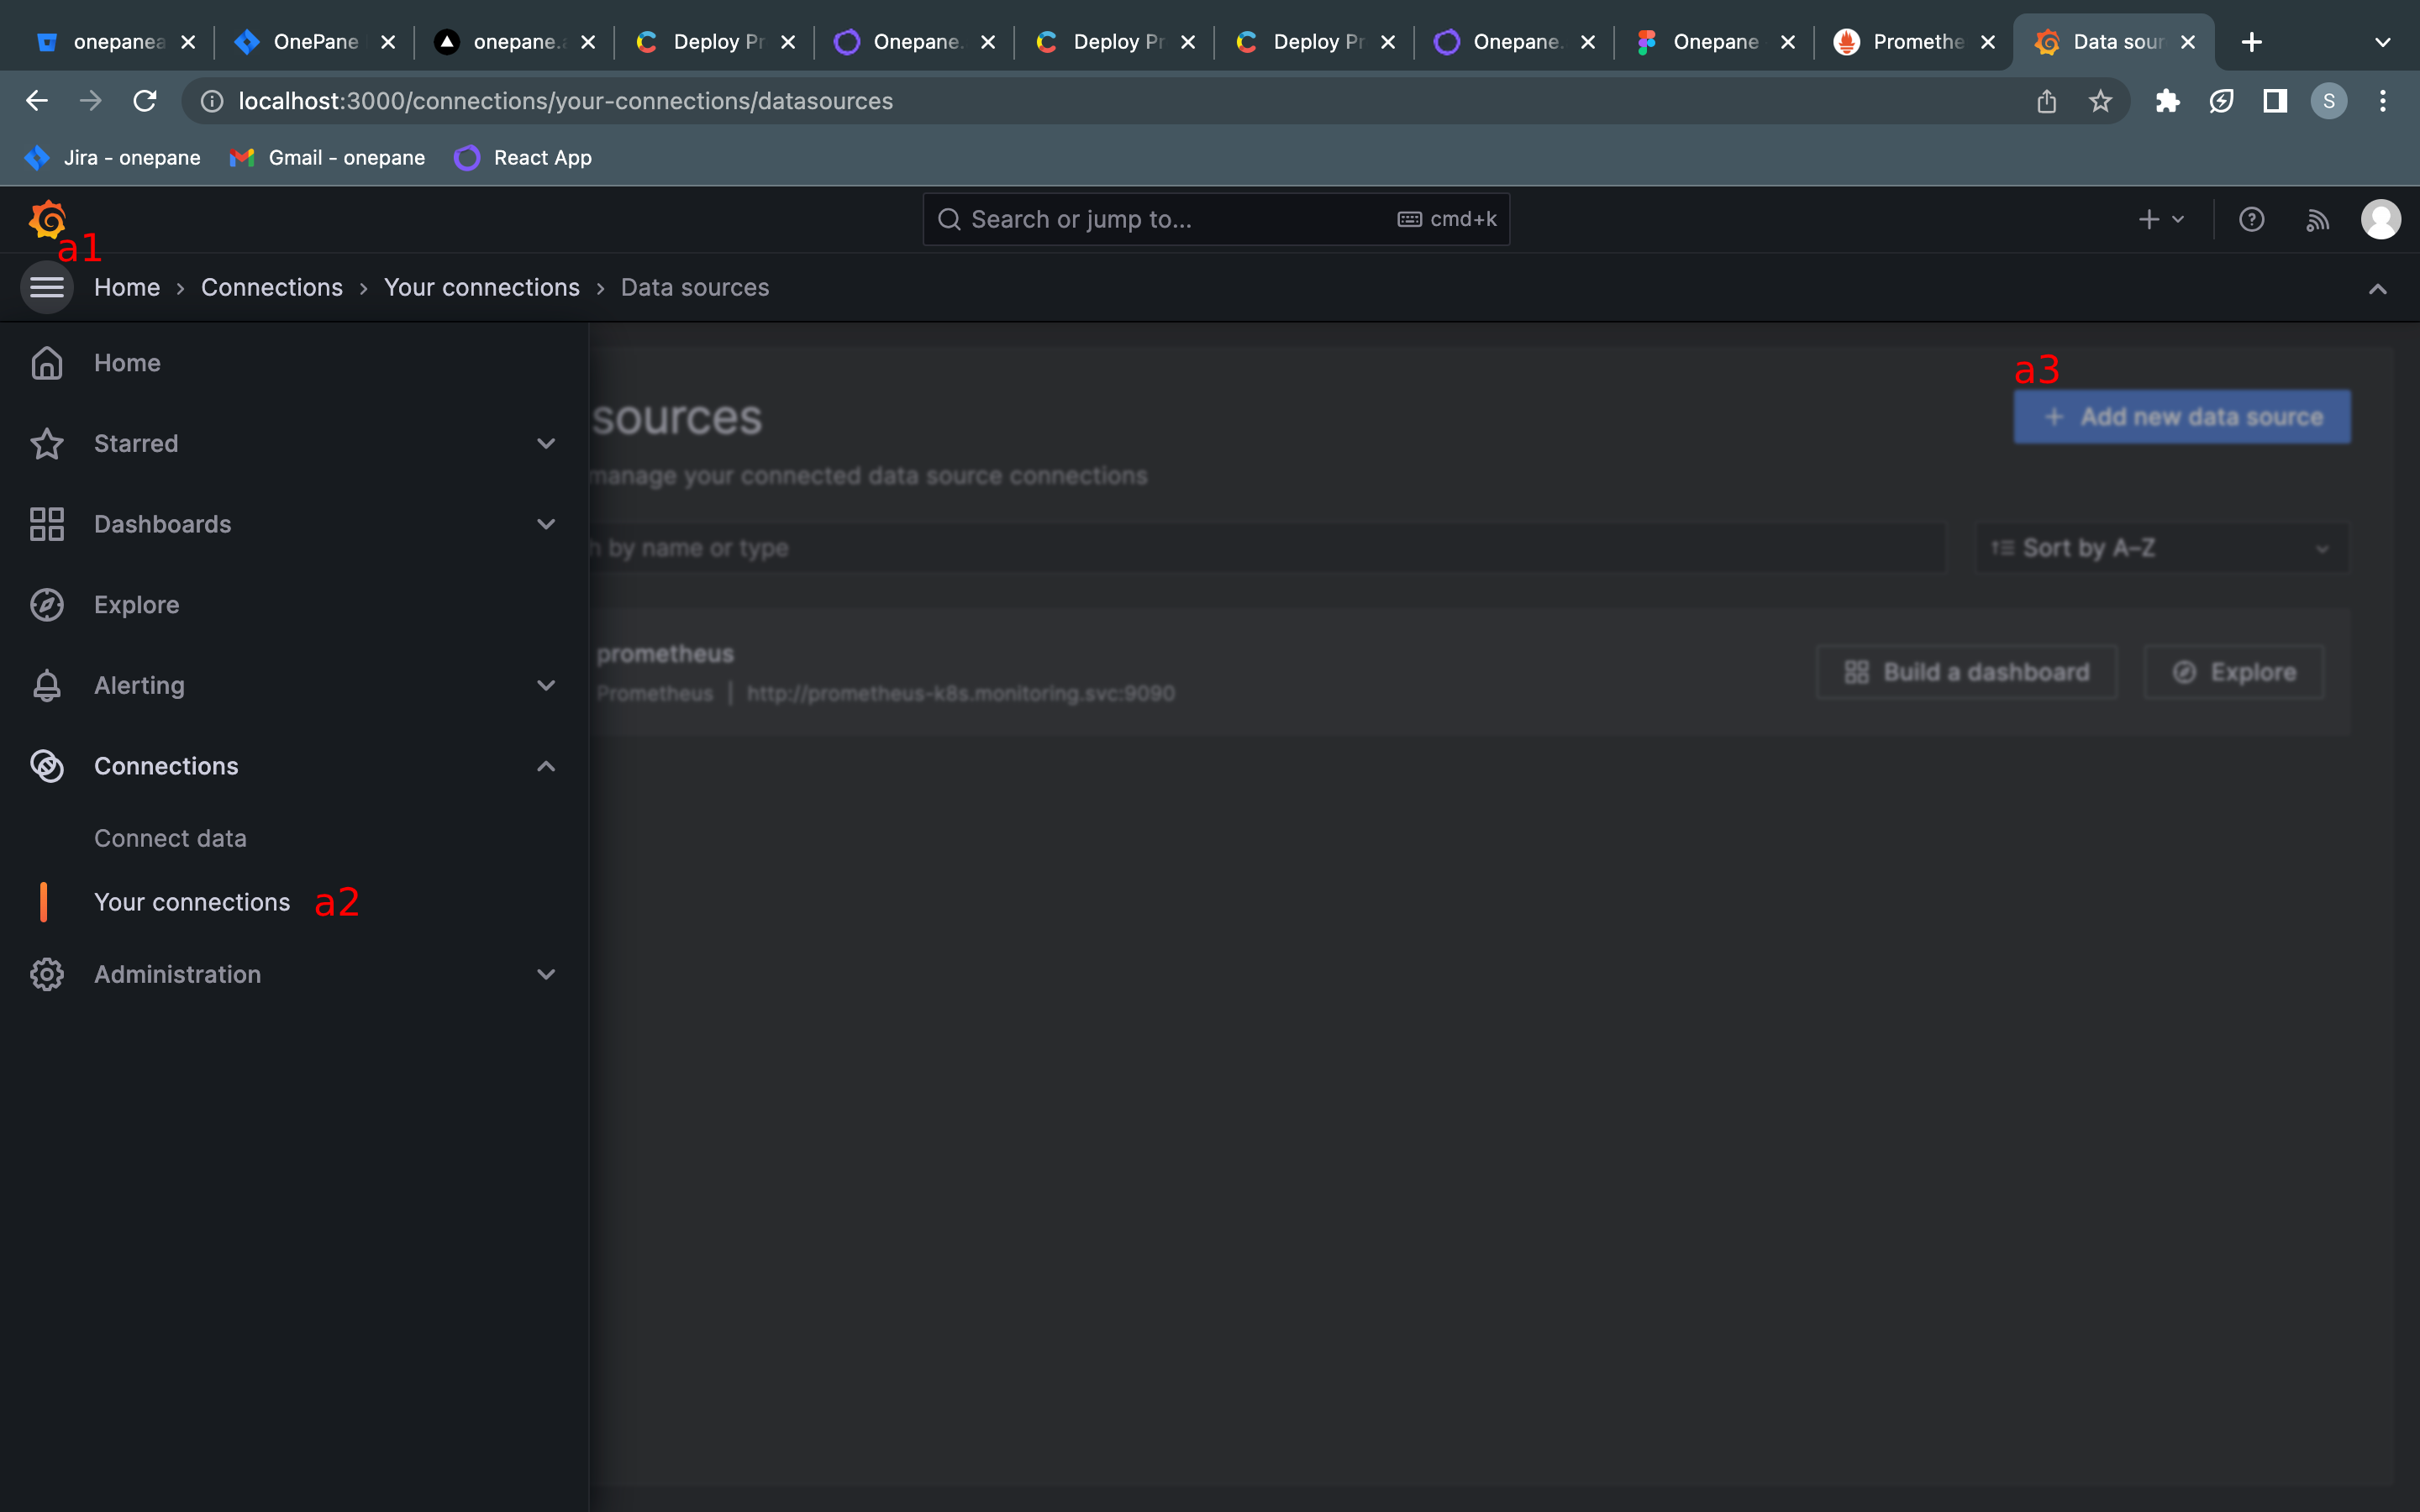
Step 1. Click on the left-side menu (a1) and select the "your connections" (a2) menu. On the page, you can see the list of existing connections.
Step 2. If you can see a Prometheus connection on the page, skip this step or, create a new Prometheus connection by clicking 'Add a new data source' (a3) at the top right corner. you will get a new page like below
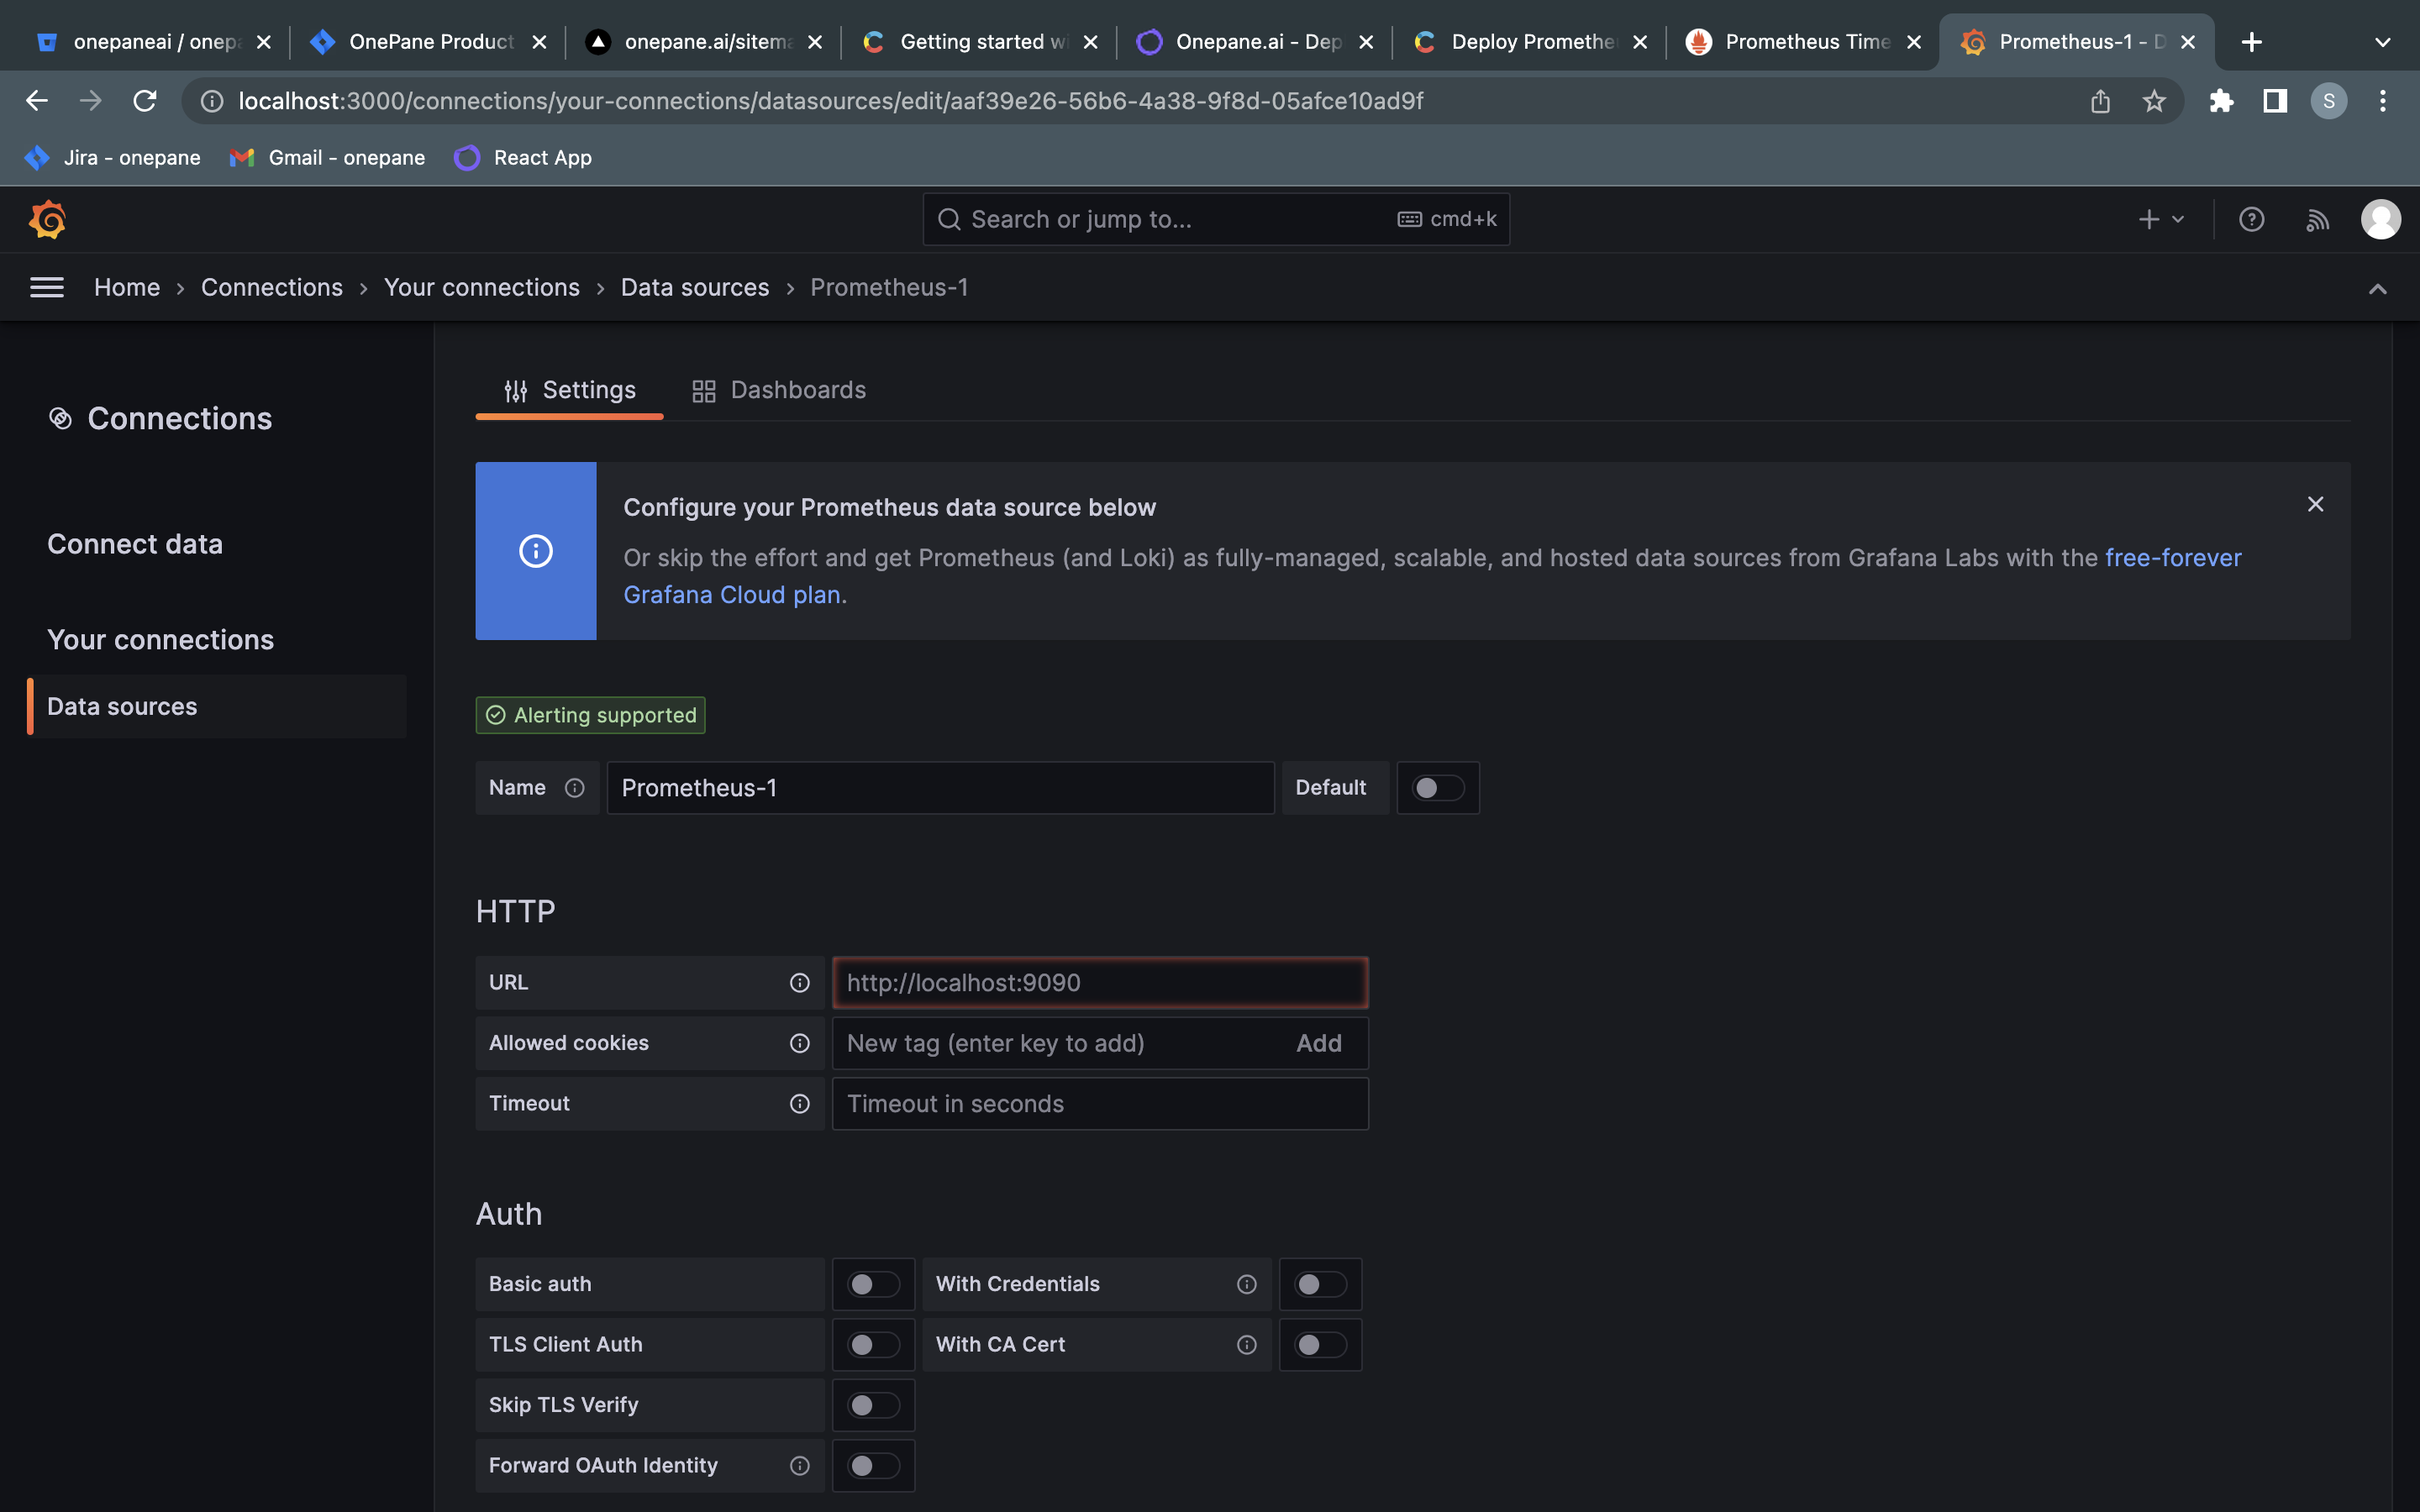
add a name (b1) for the connection and URL (b2) of the Prometheus. here we are using the k8s service URL 'http://prometheus-k8s.monitoring.svc:9090'. add these two data and click on the 'Save and test' (b3) button.
now you can see your new Prometheus connection in the list.
the Grafana Prometheus connection is ready now, so we create some visualization on kube metrics. Grafana supports various visualization like,
- Timeseries
- Bar chart
- Gauge
- Stats
- Table
- Heat map
- Pie chart
navigate to the home page of Grafana, there is a 'Add' button top right corner, and select 'Visualization' from the dropdown. then you will get a page like below
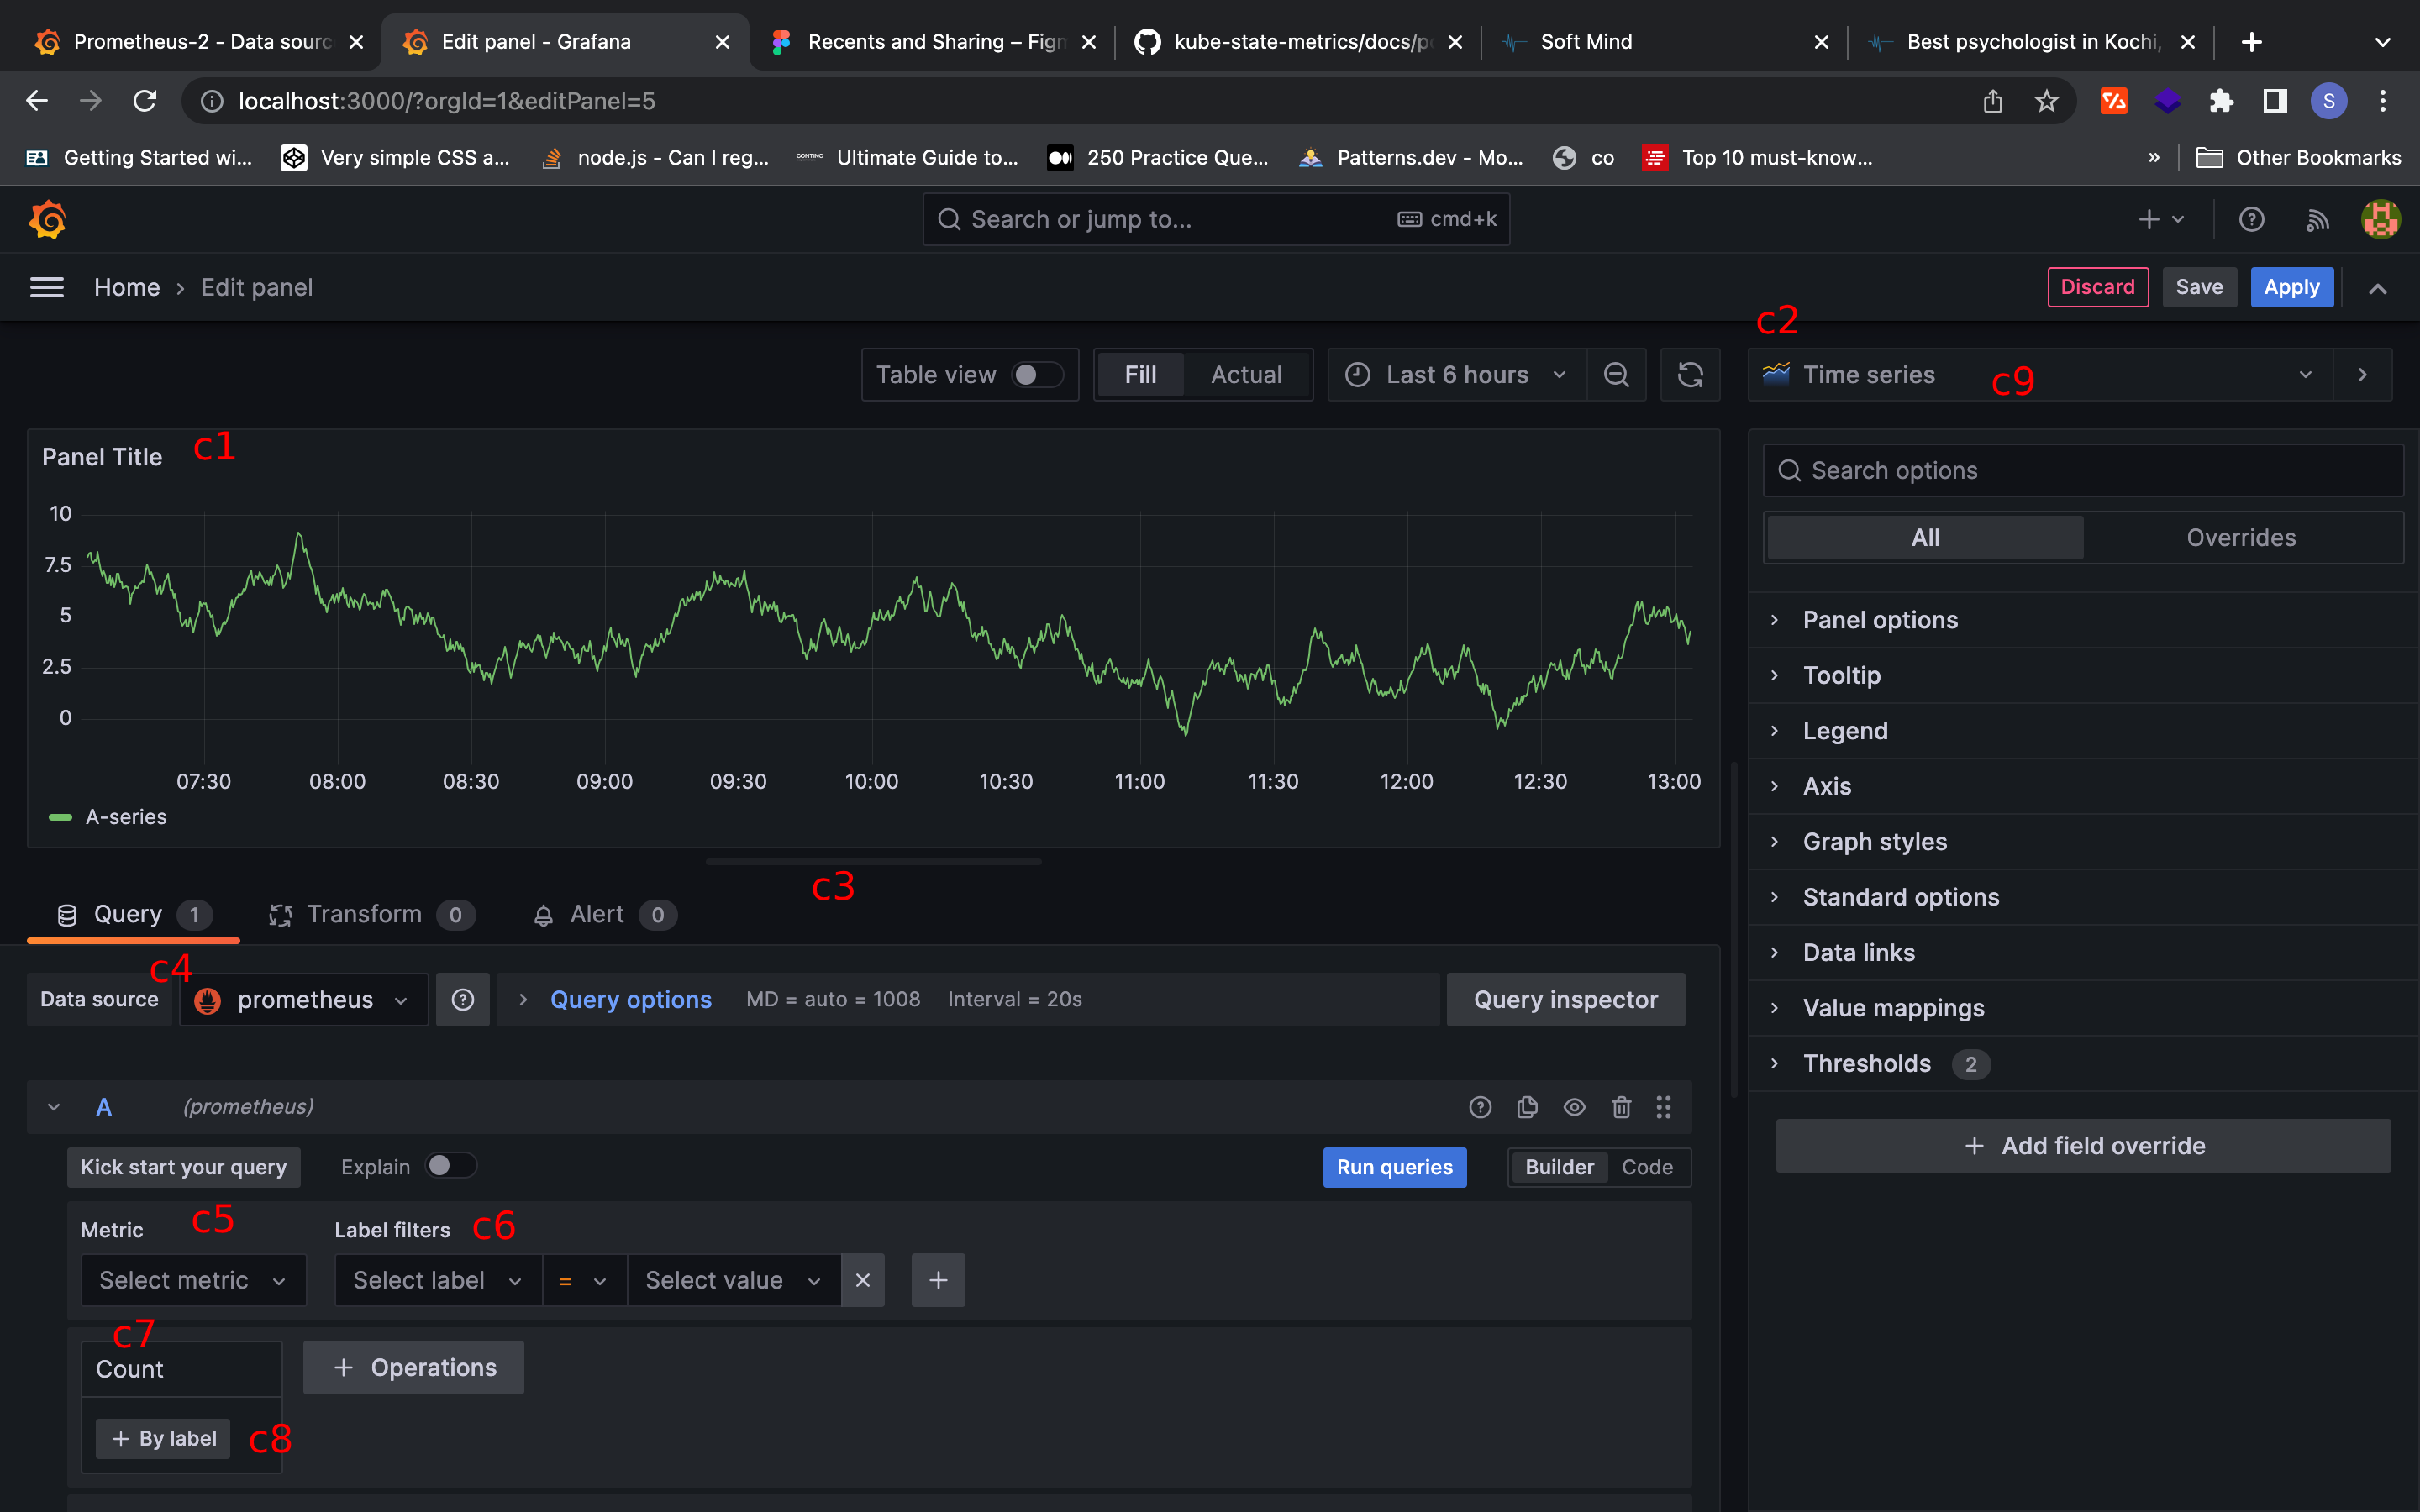
this page has 3 sections
- Visualization Preview (c1)- shows the select chart or visualization preview based on the given data
- Visualization Properties (c2) - each chart or visualization has its own properties, which can change from this section
- Data (c3) - Select the data source for the visualization, and apply different options to the data, like filter and different operations like sum, count, group, etc.
Here we are creating a small visualization for how many pods and deployments run in a namespace. to get the data we are using to kube metrics
- kube_deployment_created
- kube_pod_created
follow the below steps to create a new visualization.
Step 1: Select prometheus connection from the 'Data source' (c4) drop in the bottom data panel,
Step 2: Now you can see the available metrics are listed in the 'Metric' (c5) dropdown menu. Search for 'kube_deployment_created' and select it. near the dropdown (c6) there is an option for filtering the data, leave it now, we don't want to filter the data now.
Step 3: we want to count the deployments in each namespace, so we need to group them by operation (c7), there are many data options available some of them are listed below,
- Aggregation
- Range Function
- Function
- Time Function
- Binary Operation
- Trigonometric
here we are using the count operation, count deployment by namespace, so we need to select the 'namespace' as the label (c8).
Step 4: Now generated the values to visualize the chart, next we need to select a visualization chart to show the values. on the top of the right side panel (c9) there is a dropdown. which lists the available charts, select Stat chart, and you will get an output like the one below, you can see many chart properties in the right side panel (c10).
do the same step with the 'kube_pod_created' metric. you will get two charts on the home page like below
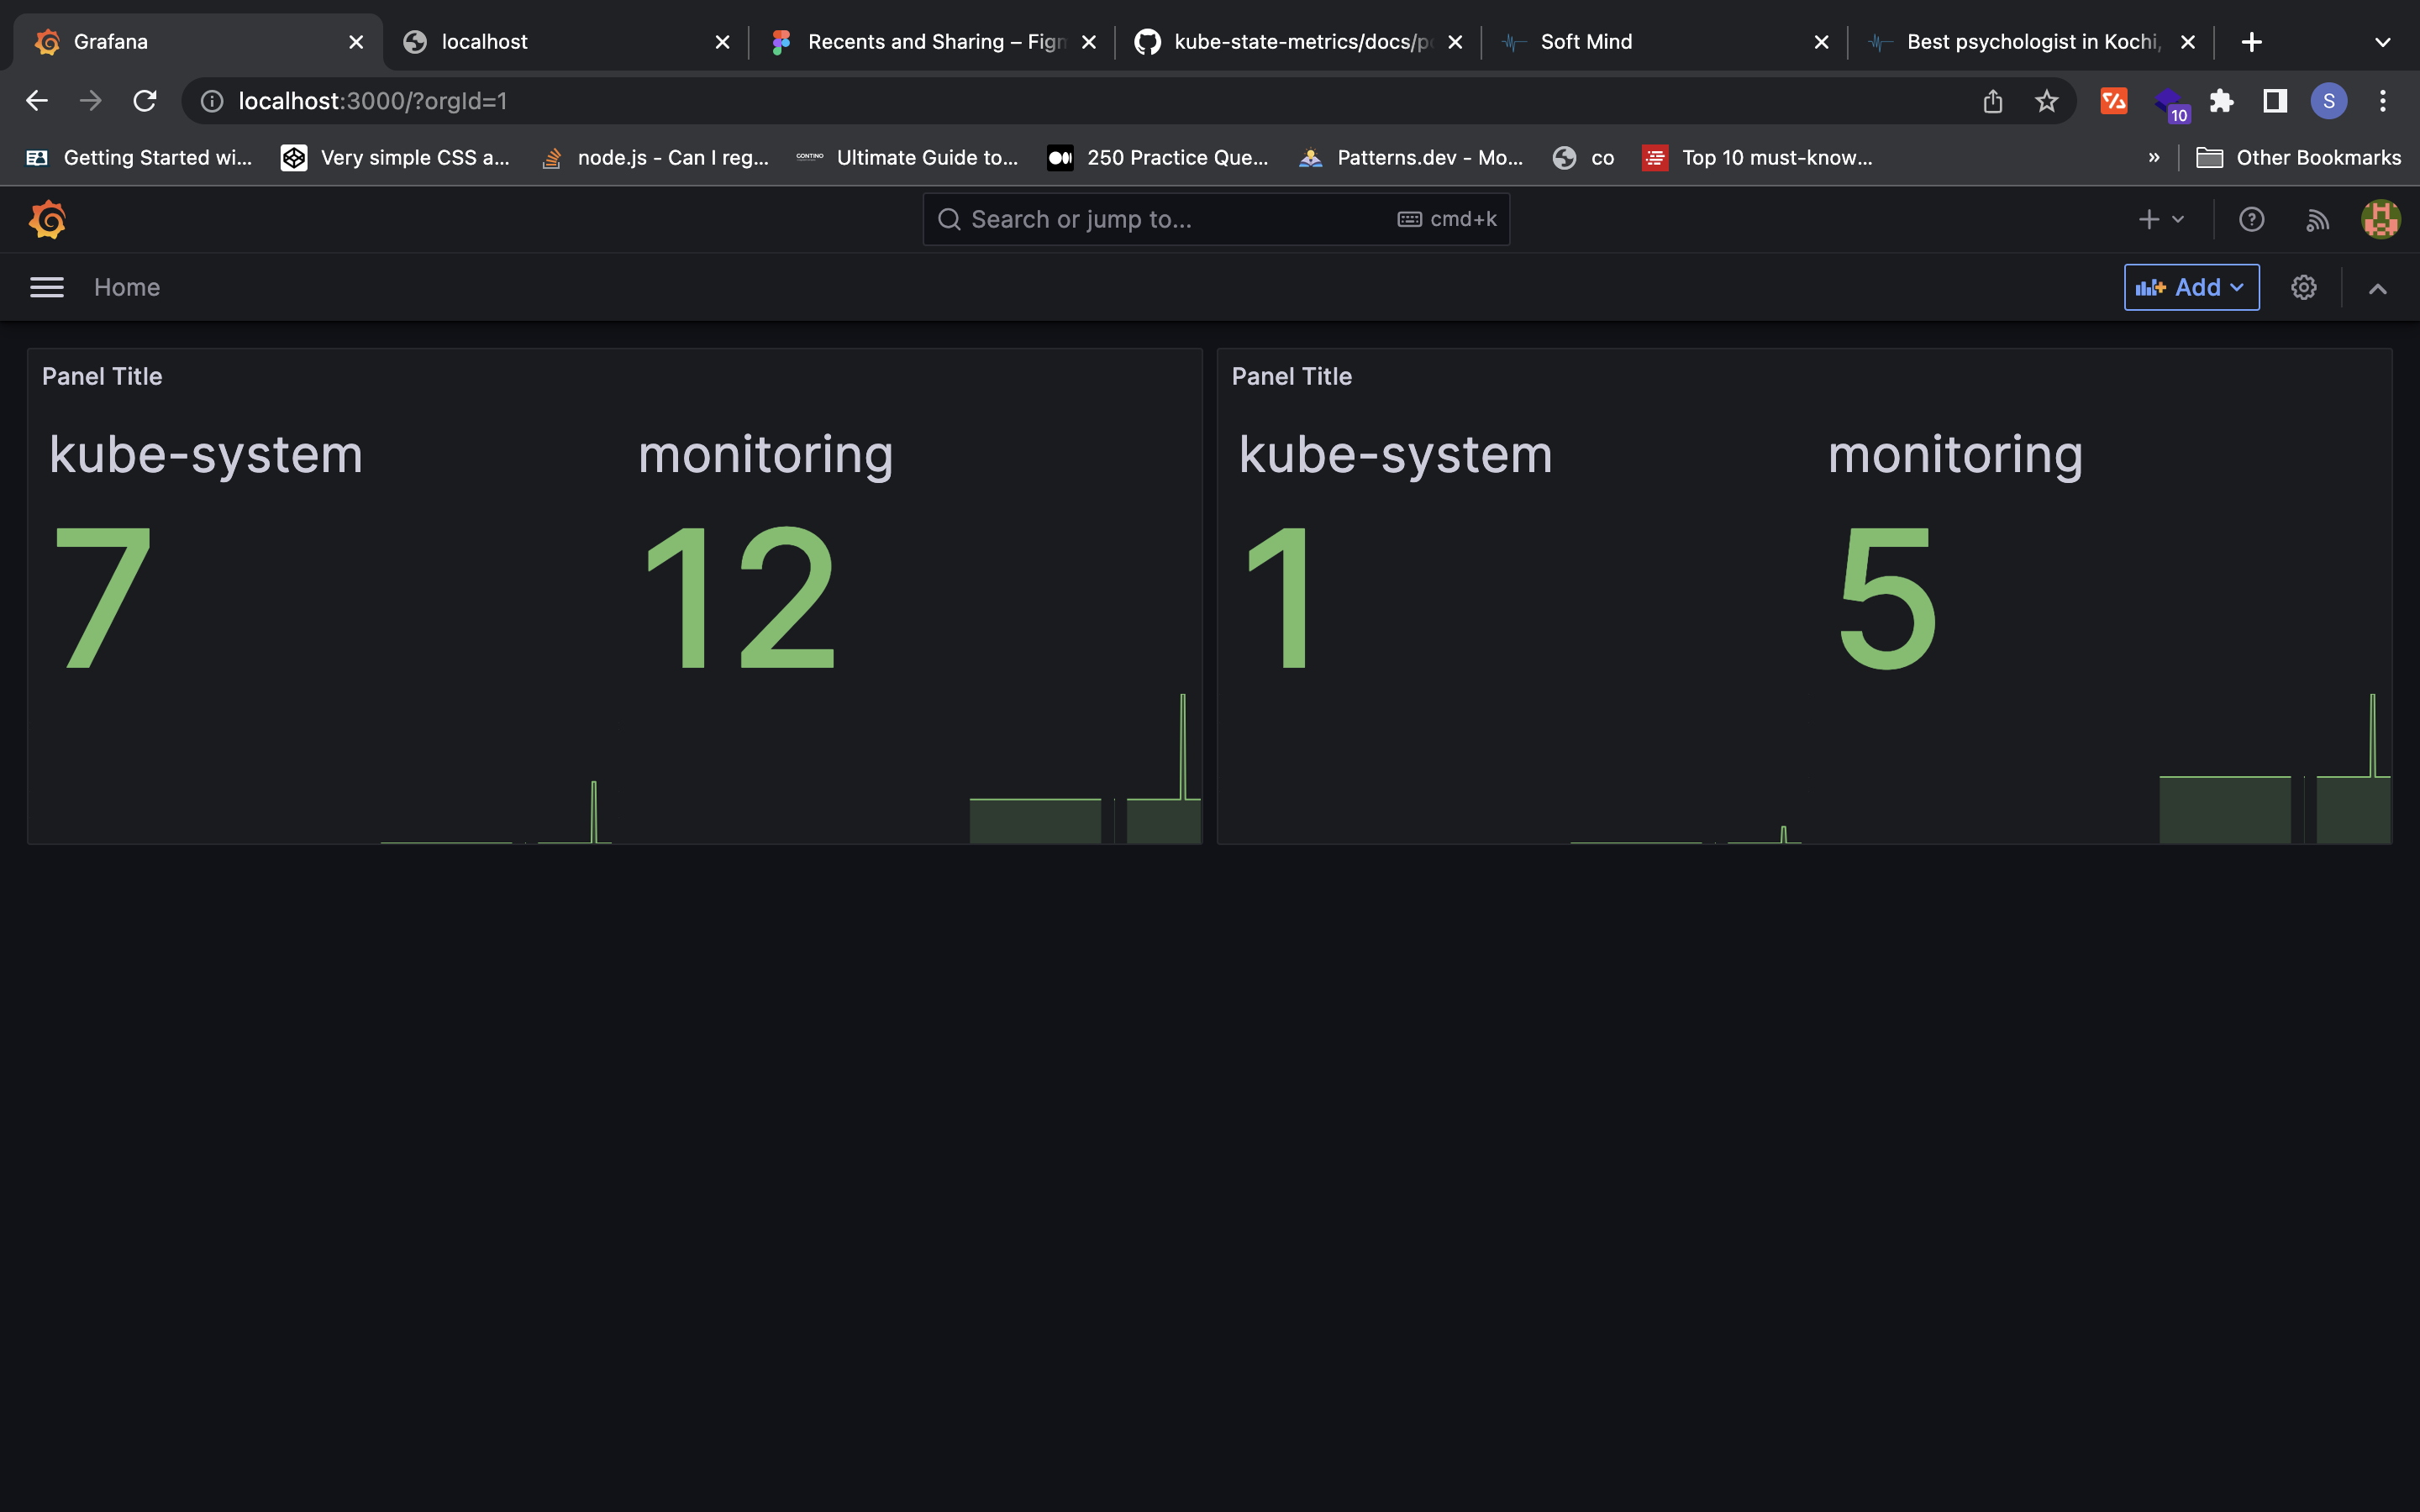
we can create a custom dashboard to monitor various things in Grafana. Also, Grafana provides many inbuild dashboards.