Prometheus is an open-source time-series database for storing metrics of Systems and Applications. Prometheus saves data in the format of metrics and query them in different ways for creating dashboards and Alerts.
Prometheus using Kubernetes Operator
Prometheus can be deployed in a Kubernetes cluster easily using Helm if you are familiar with Helm. In this article, we will be installing with Kubernetes operator
Here we are using kube-promethues operator for installing prometheus components in the Kubernetes cluster. We are configuring Prometheus on the same cluster which needs to be monitored, this is not a best practice for production. Let's see how to configure prometheus in different ways. if you are looking for a installation steps skip to second part.
Prometheus Deployment Methods
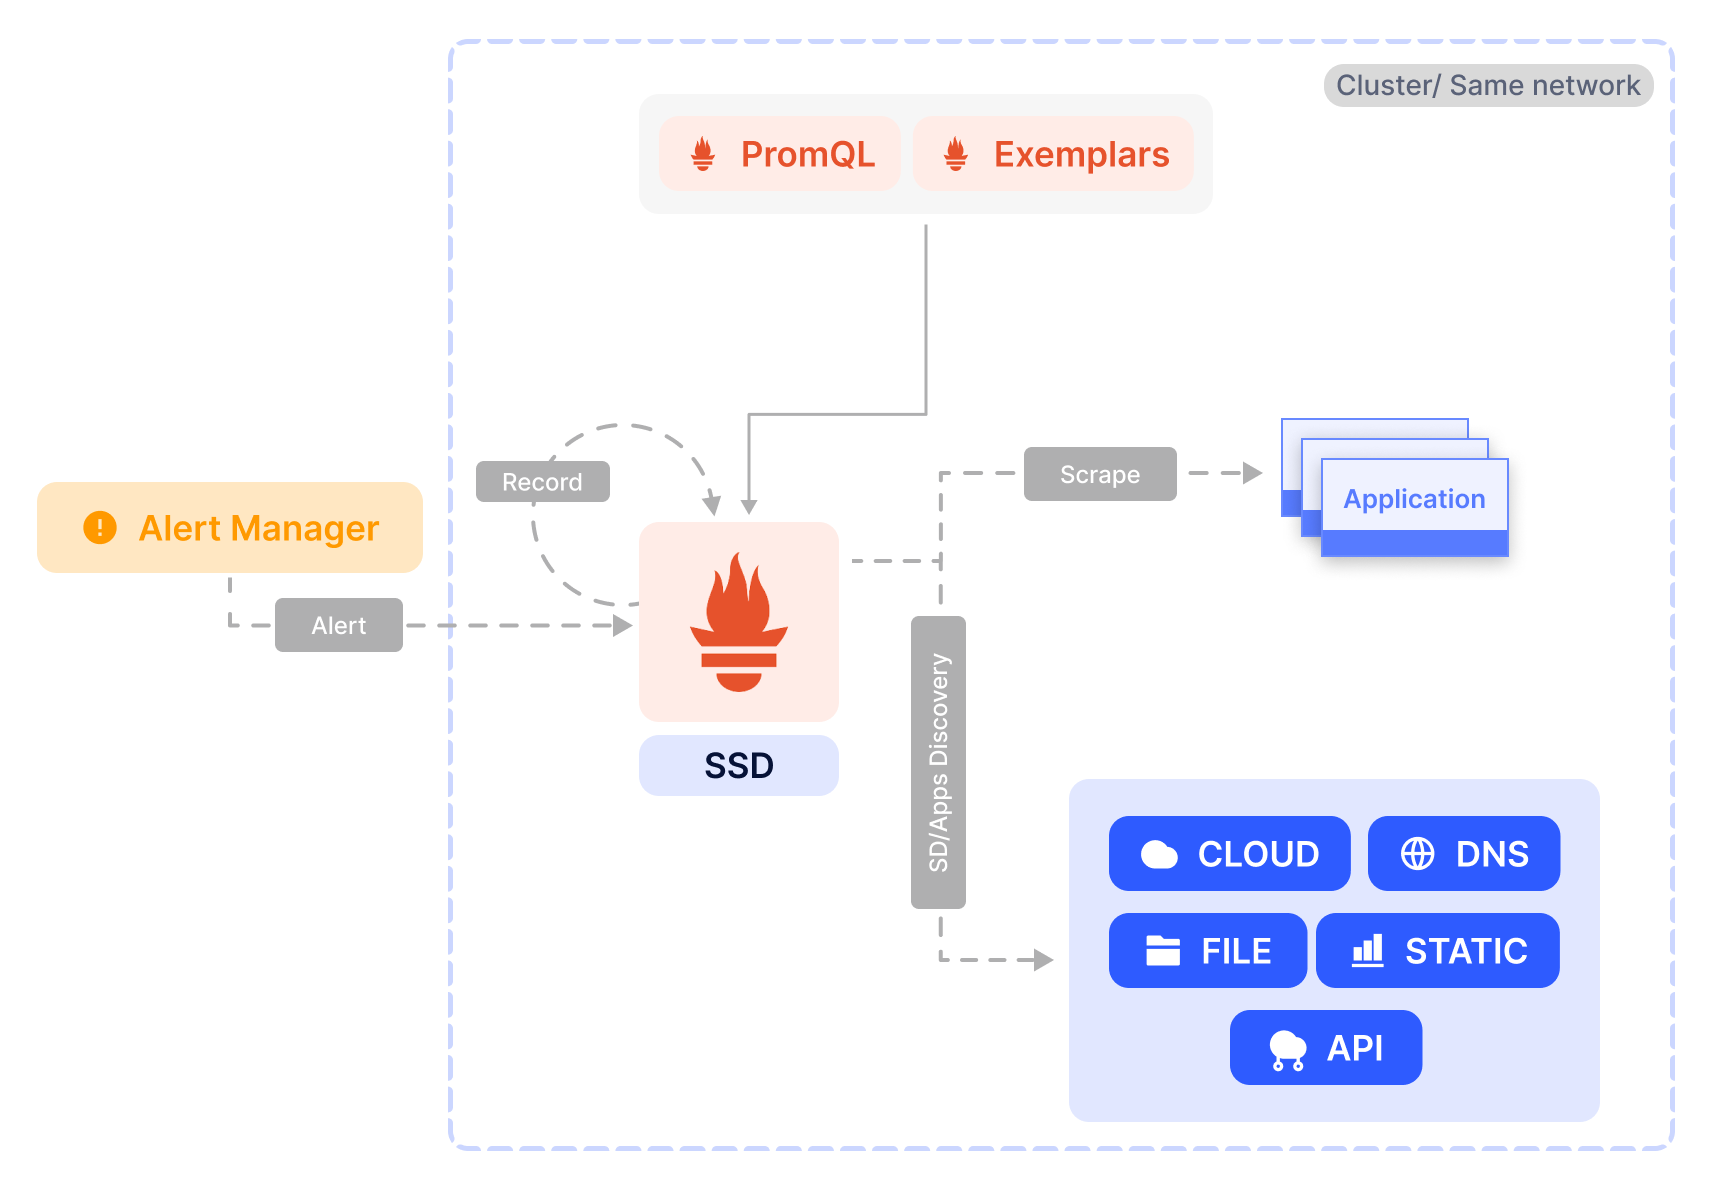
Normally the installation of prometheus is along with the application which we want to monitor, the prometheus is installed in the same cluster and we configure the prometheus to pull the metrics data from the application at regular intervals, this method is referred to as the 'pull model'. the deployment architecture of the 'pull model' is shown below.
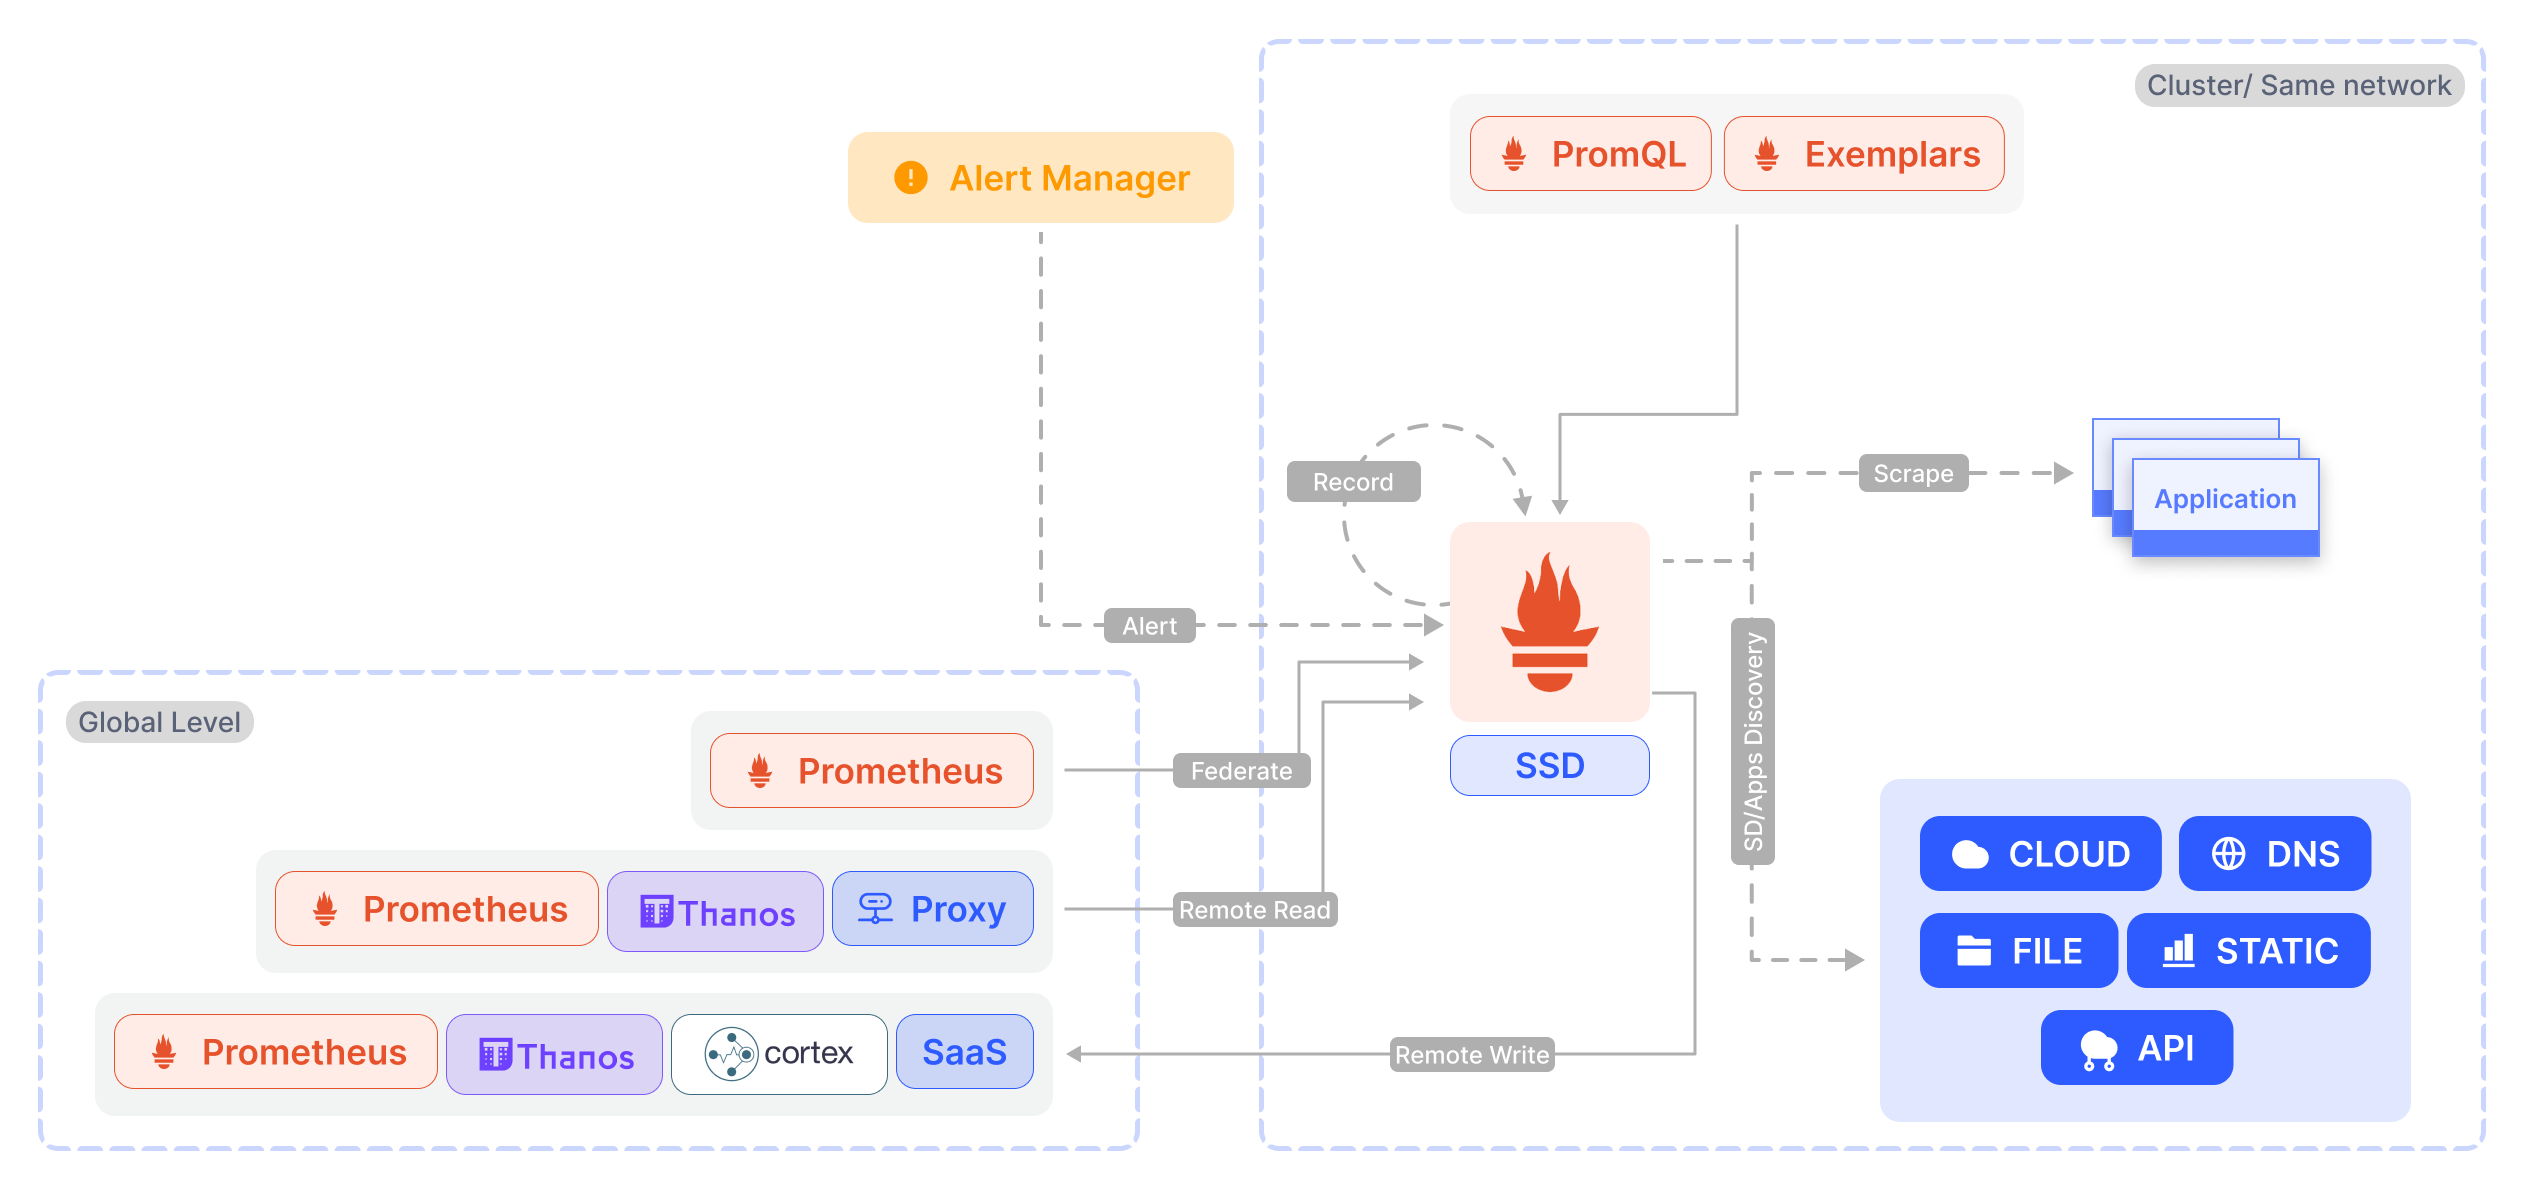
Another way to configure prometheus is Globally. Consider we need to monitor multiple applications which are deployed in different clusters. So we need to set up prometheus globally, applications push metrics data to remote prometheus, and the metrics data are aggregated and stored at Global Level, this method of deployment is known as 'Global View'.
there are some issues when configuring prometheus globally,
- scraping data across network boundaries can be a challenge. we are scraping the data outside of the network, so there will be a chance to lose some of the information, also the visibility will completely lose if the network is down.
- when we monitor a large number of applications, all applications are pushing metrics data to the remote cluster. there will be a chance to fail to connect the remote cluster. Also, the applications are sending the metrics, if the remote cluster didn't get the metrics from the applications we can't identify the problems, if the application is down or the application failed to authorize.
there are 3 types of Global View
- Federation is the first featured for aggregation purposes. Install prometheus in all clusters and set one as globally which can connect all the leaf prometheus. Global-level prometheus scrap data from the leaf prometheus, the federation prometheus has the original samples timestamps, so the metrics data will not lose if it is any network issues.
- Remote Read selects raw metrics from a remote Prometheus server's database without a direct PromQL query. To perform PromQL queries, we can deploy Prometheus or other solutions (e.g. Thanos) on the global level. It only fetches the data from the remote locations when it's required. Query Pushdown is used to pull huge data from remote locations. this model will fail when any network issue happens. Also, it only supports egress.
- Remote Write, All or a subset of metrics are forwarded to a remote location which is collected by the Prometheus. Prometheus Remote Write API helps to do this. Prometheus supports both ingesting and sending Remote Write, This methods supports the 'pull model', so it can understand the failure reasons of applications.
Now let's see how to deploy prometheus with kube-prometheus
Deploy Prometheus on Kubernetes with Kube-Prometheus
Clone the kube-prometheus repository from Github using the following command
git clone https://github.com/prometheus-operator/kube-prometheus.gitGet inside the cloned directory
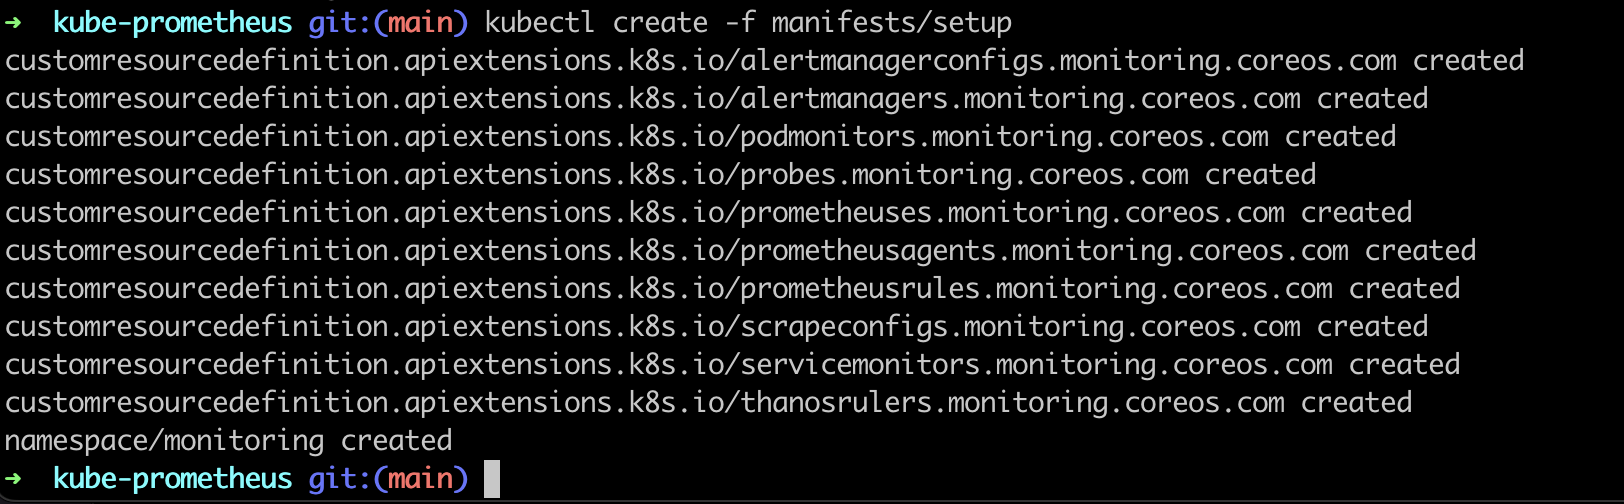
cd kube-prometheusDeploy kube-prometheus by applying yaml files in the setup directory, following create command will apply all yaml files available in the directory to create a namespace and CRDs . See the result in following screenshotkubectl create -f manifests/setup
The below command will deploy prometheus operator in the cluster on monitoring the namespace. See the result in following screenshot
kubectl create -f manifests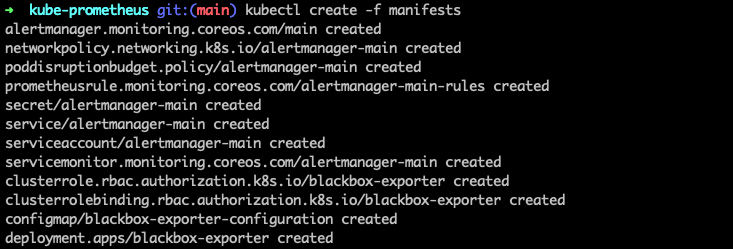
After successful installation following components will run inside the cluster.
- Prometheus : offers several options for configuring persistent storage, replication, and Alertmanager.
- Alertmanager: offers several options for configuring persistent storage and replication.
- ThanosRuler: recording and alerting rules can be processed across multiple Prometheus instances.
- ServiceMonitor: determines which services should be monitored.
- PodMonitor: determines which pods should be monitored.
- Probe: define how groups of ingresses and static targets should be monitored.
- PrometheusRule: defines rules for alertmanager
Once the Prometheus is installed use the following commands to port forward the services to your machine and access it with the browser
Grafanakubectl --namespace monitoring port-forward svc/grafana 3000
Endpoint - localhost:3000
to access Prometheuskubectl --namespace monitoring port-forward svc/prometheus-k8s 9090
Endpoint - localhost:9090
to access Alertmanagerkubectl --namespace monitoring port-forward svc/alertmanager-main 9093
Endpoint - localhost:9093
Now you have prometheus setup on your kubernetes. If you want to uninstall it, you can uninstall kube-prometheus and the Prometheus Operator by running:kubectl delete --ignore-not-found=true -f manifests/ -f manifests/setup
Hope this blog helped you to get started with Prometheus installation, we will continue this series with installation using helm and more exercises on kubernetes