
Last blog we discussed “How to deploy Prometheus using the kube operator”. Here we discuss how to use Prometheus and Grafana.
We can monitor our own application by instrumenting Prometheus on code. Here we are monitoring a Kubernetes cluster with the help of some Kubernetes metrics.
Before that, we can learn some Prometheus terms,
- PromQL - PromQL is a query language used to retrieve the metric data from Prometheus.
- Node Exporter - Node Exporter is an agent that collects server-related metrics and statistical data for monitoring. It running on 9001 port.
- Alert Manager - Helps to create alerts, Alerts can be for CPU usage, memory usage, and request duration, response status.
- PushGateway - Pushgateway sends the metrics into the ecosystem instead of relying on pull mechanisms
- Service Discovery - Service Discovery is the process of automatically discovering and monitoring the targets. Prometheus supports Static Configurations, File-based Service Discovery, Consul Service Discovery, and Kubernetes Service Discovery.
Prometheus metrics are human-readable text format, which has two attributes HELP and TYPE, HELP is the description of the matrics.
4 types of Prometheus metrics
- Counter - Counter Metrics are used for measurement that is only for increase. The value can only increment, or be set to zero. When start or restart time the value will be zero.
- Gauge - A Gauge is a numeric value that can be increased or decreased. For example the value of CPU usage or memory usage.
- Histogram - Histogram metrics are useful to represent a distribution of measurements. They are often used to measure request duration or response size. Histogram divides the entire range of measurements into a set of intervals.
- Summary - the summary is the same as Histogram, is useful to measure request duration and response sizes.
Node exporter is Already deployed on Kubernetes while you install prometheus on cluster. You can access the metric from the endpoint by port-forwarding it to localhost http://localhost:9100/metrics. You can define your own endpoint on the application to export the application metrics. That endpoint should be added in the Prometheus configuration YAML file. By default, Prometheus pulls the metrics from the http://localhost:9100/metrics endpoint.
To access node exporter port-forward the service
kubectl --namespace monitoring port-forward svc/node-exporter 9100Kubernetes has many metrics like CPU, Memory Usage, namespace, deployment, and pod details. These can see in the metric data in Prometheus. To access Prometheus go to “http://localhost:9090/“. you will get a window like below.
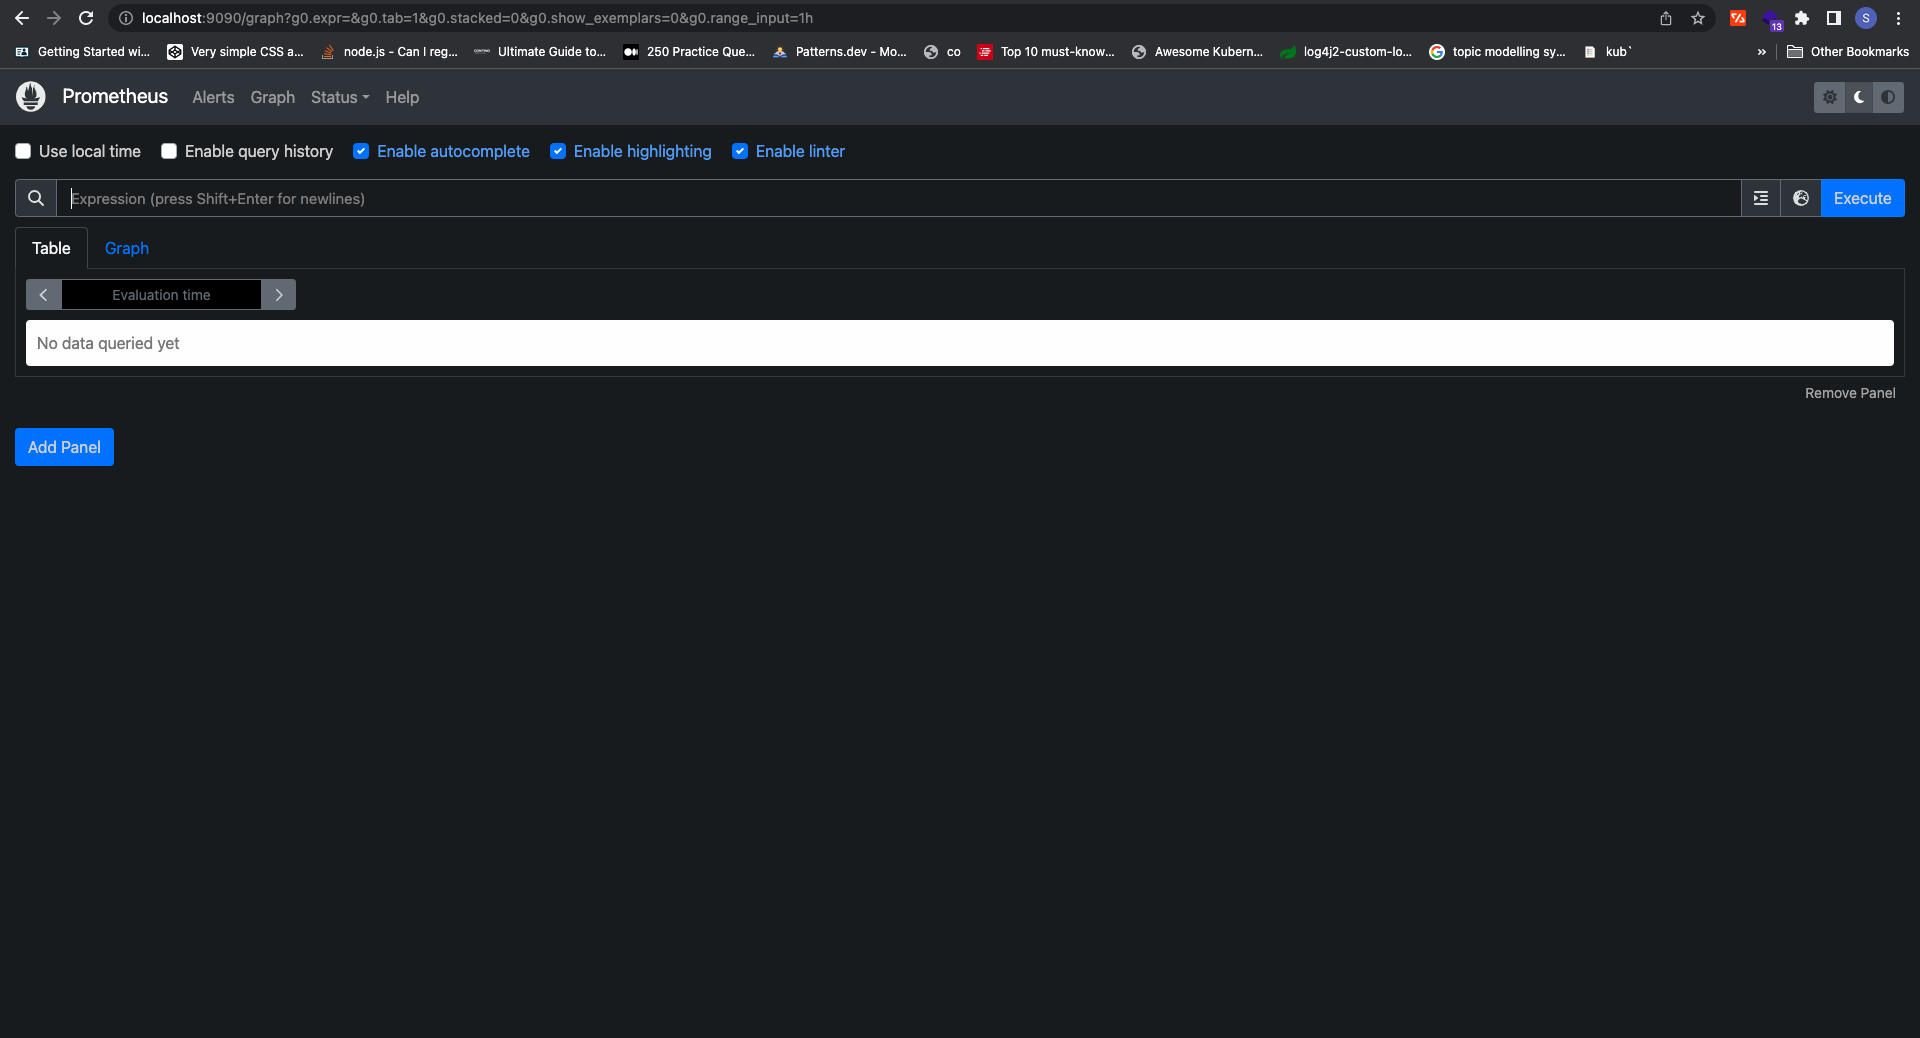
there is an Expression input box, you enter a metric in the input box and click on the “Execute” button you will get the metric data below, in a table or graph view. you can filter the data by Evaluation and time range.
Use the “kube_configmap_created” metric to get the config map metrics, you see there are some attributes like configmap, namespace, and container.
We can filter the data by these attributes for there are many query functions to perform various operations, like abs(), ceil(), clamp(), and exp(). To learn more about the query function click here
In Prometheus, the visualizations are limited so, so we can Grafana tool, to visualize these data. Grafana has many charts to display data.
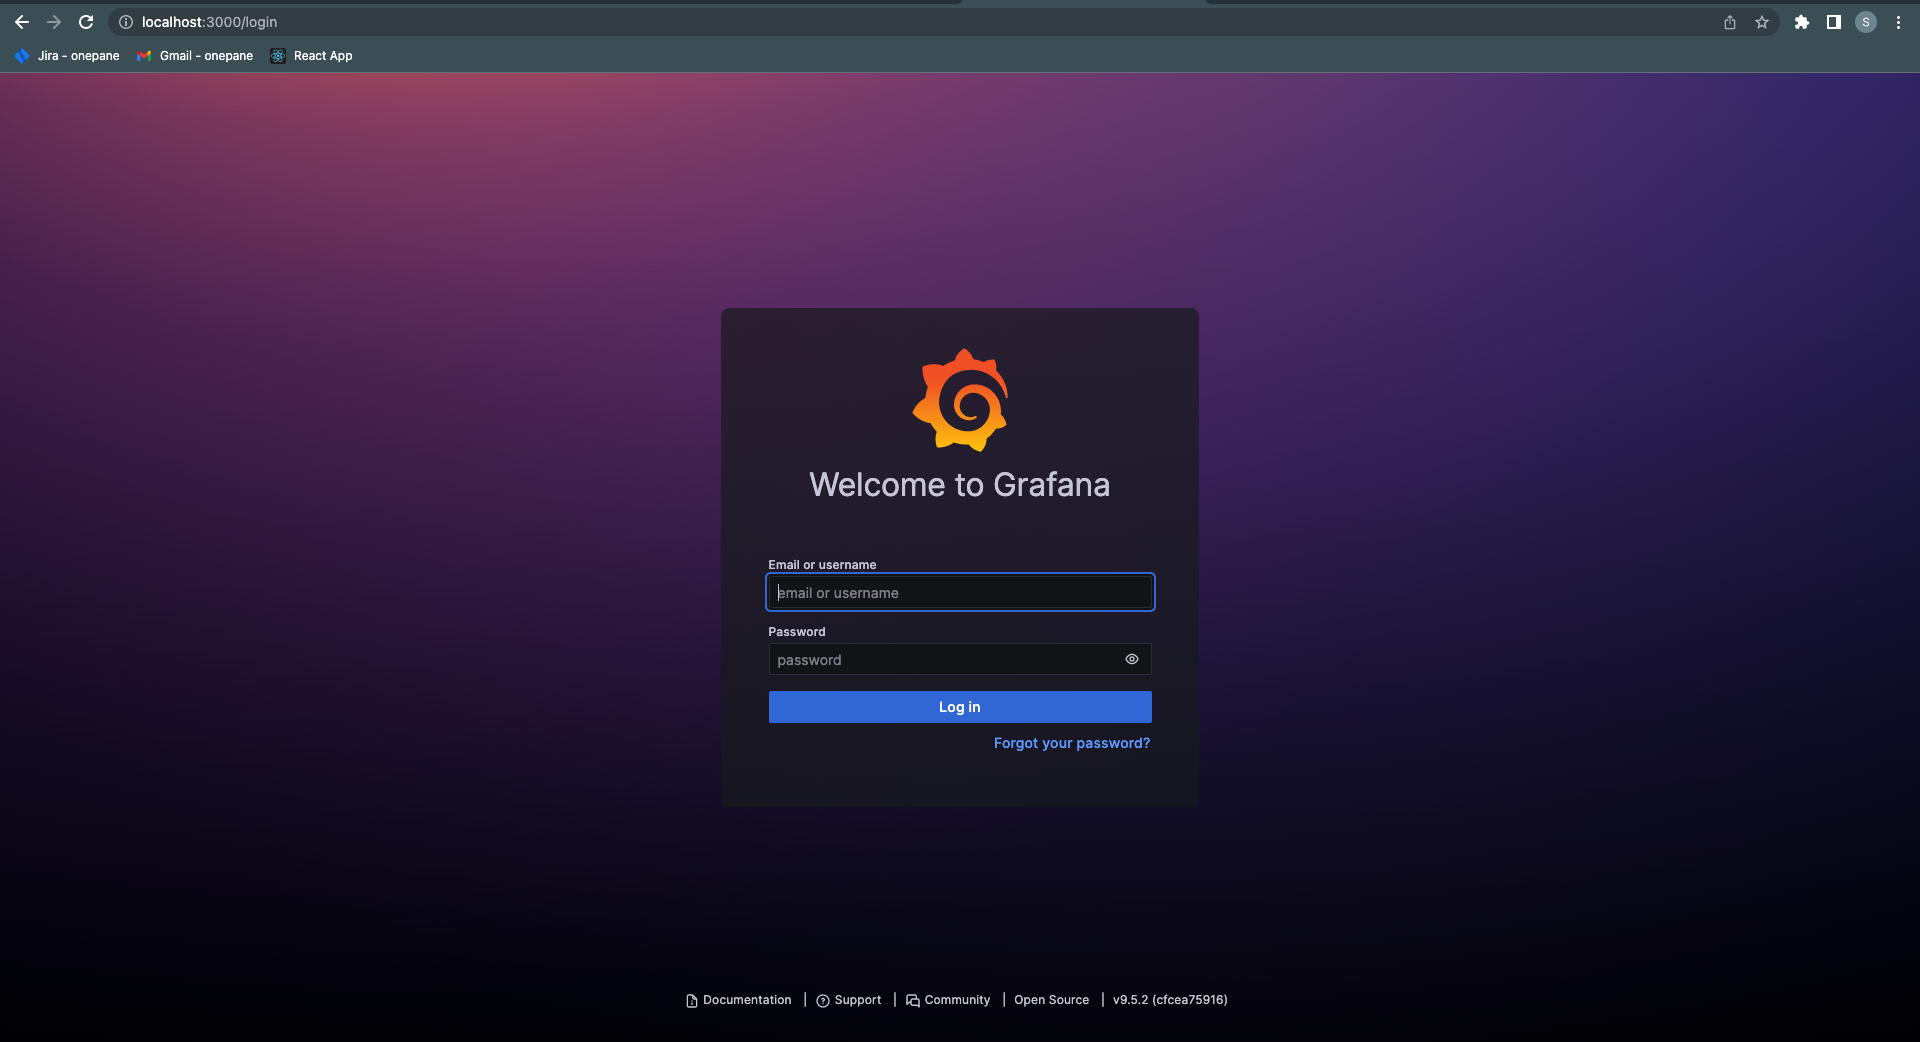
To access Grafana go to ‘http://localhost:3000/“. You will get a Grafana login screen, the default username and password is “admin”.
By login, you will get a dashboard like below
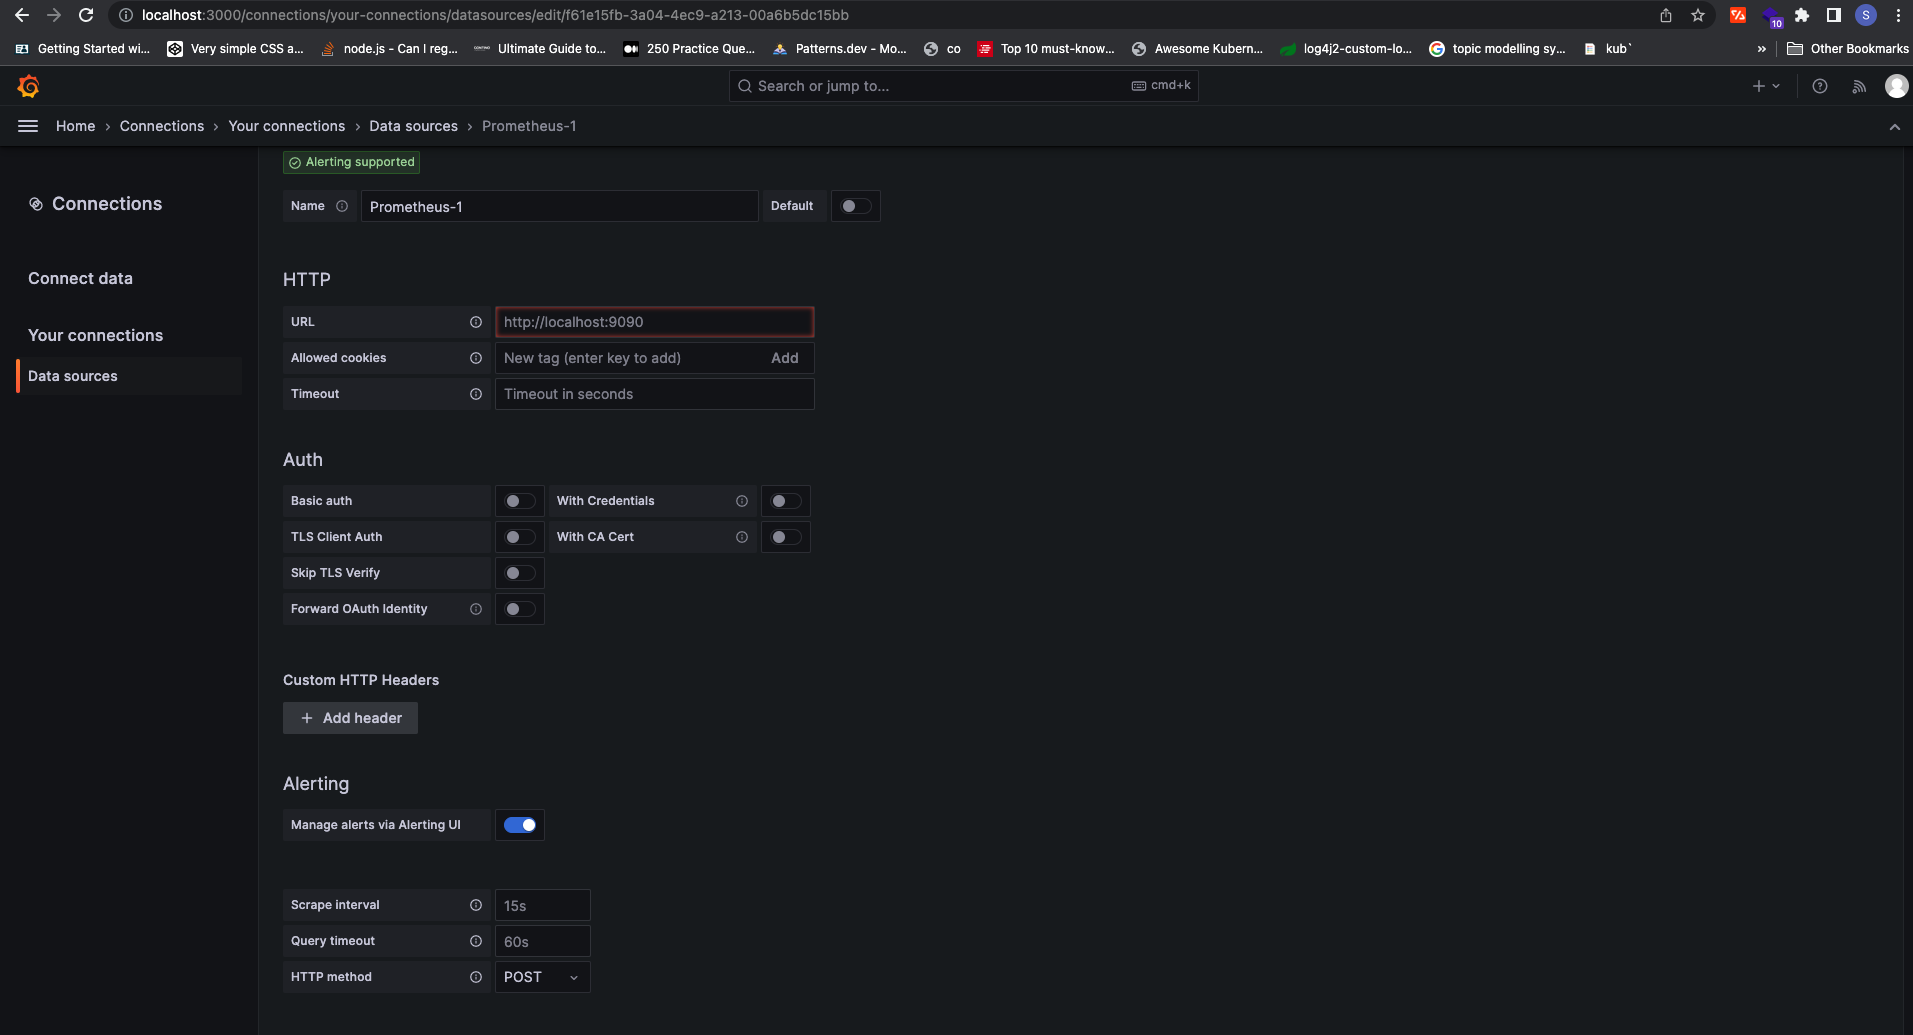
First of all, we want to connect Grafana with Prometheus, Grafana supports many data sources, you can see that in the connection menu. By default, the Prometheus connection is already created. you can view the connection in connection->your connection, if the connection is not created add a new connection, by clicking the Prometheus icon in the data source list and clicking “create a Prometheus data source". You will get a screen like below and click save and test
Then create a dashboard to visualize the Kubernetes data. Grafana provides preset dashboards for visualizing the Kubernetes metrics. to view the preset dashboard navigate to Dashboard-> Default Folder -> "Kubernetes / Compute Resources / Cluster". You can see the dashboard, which shows CPU usage, Memory Usage.
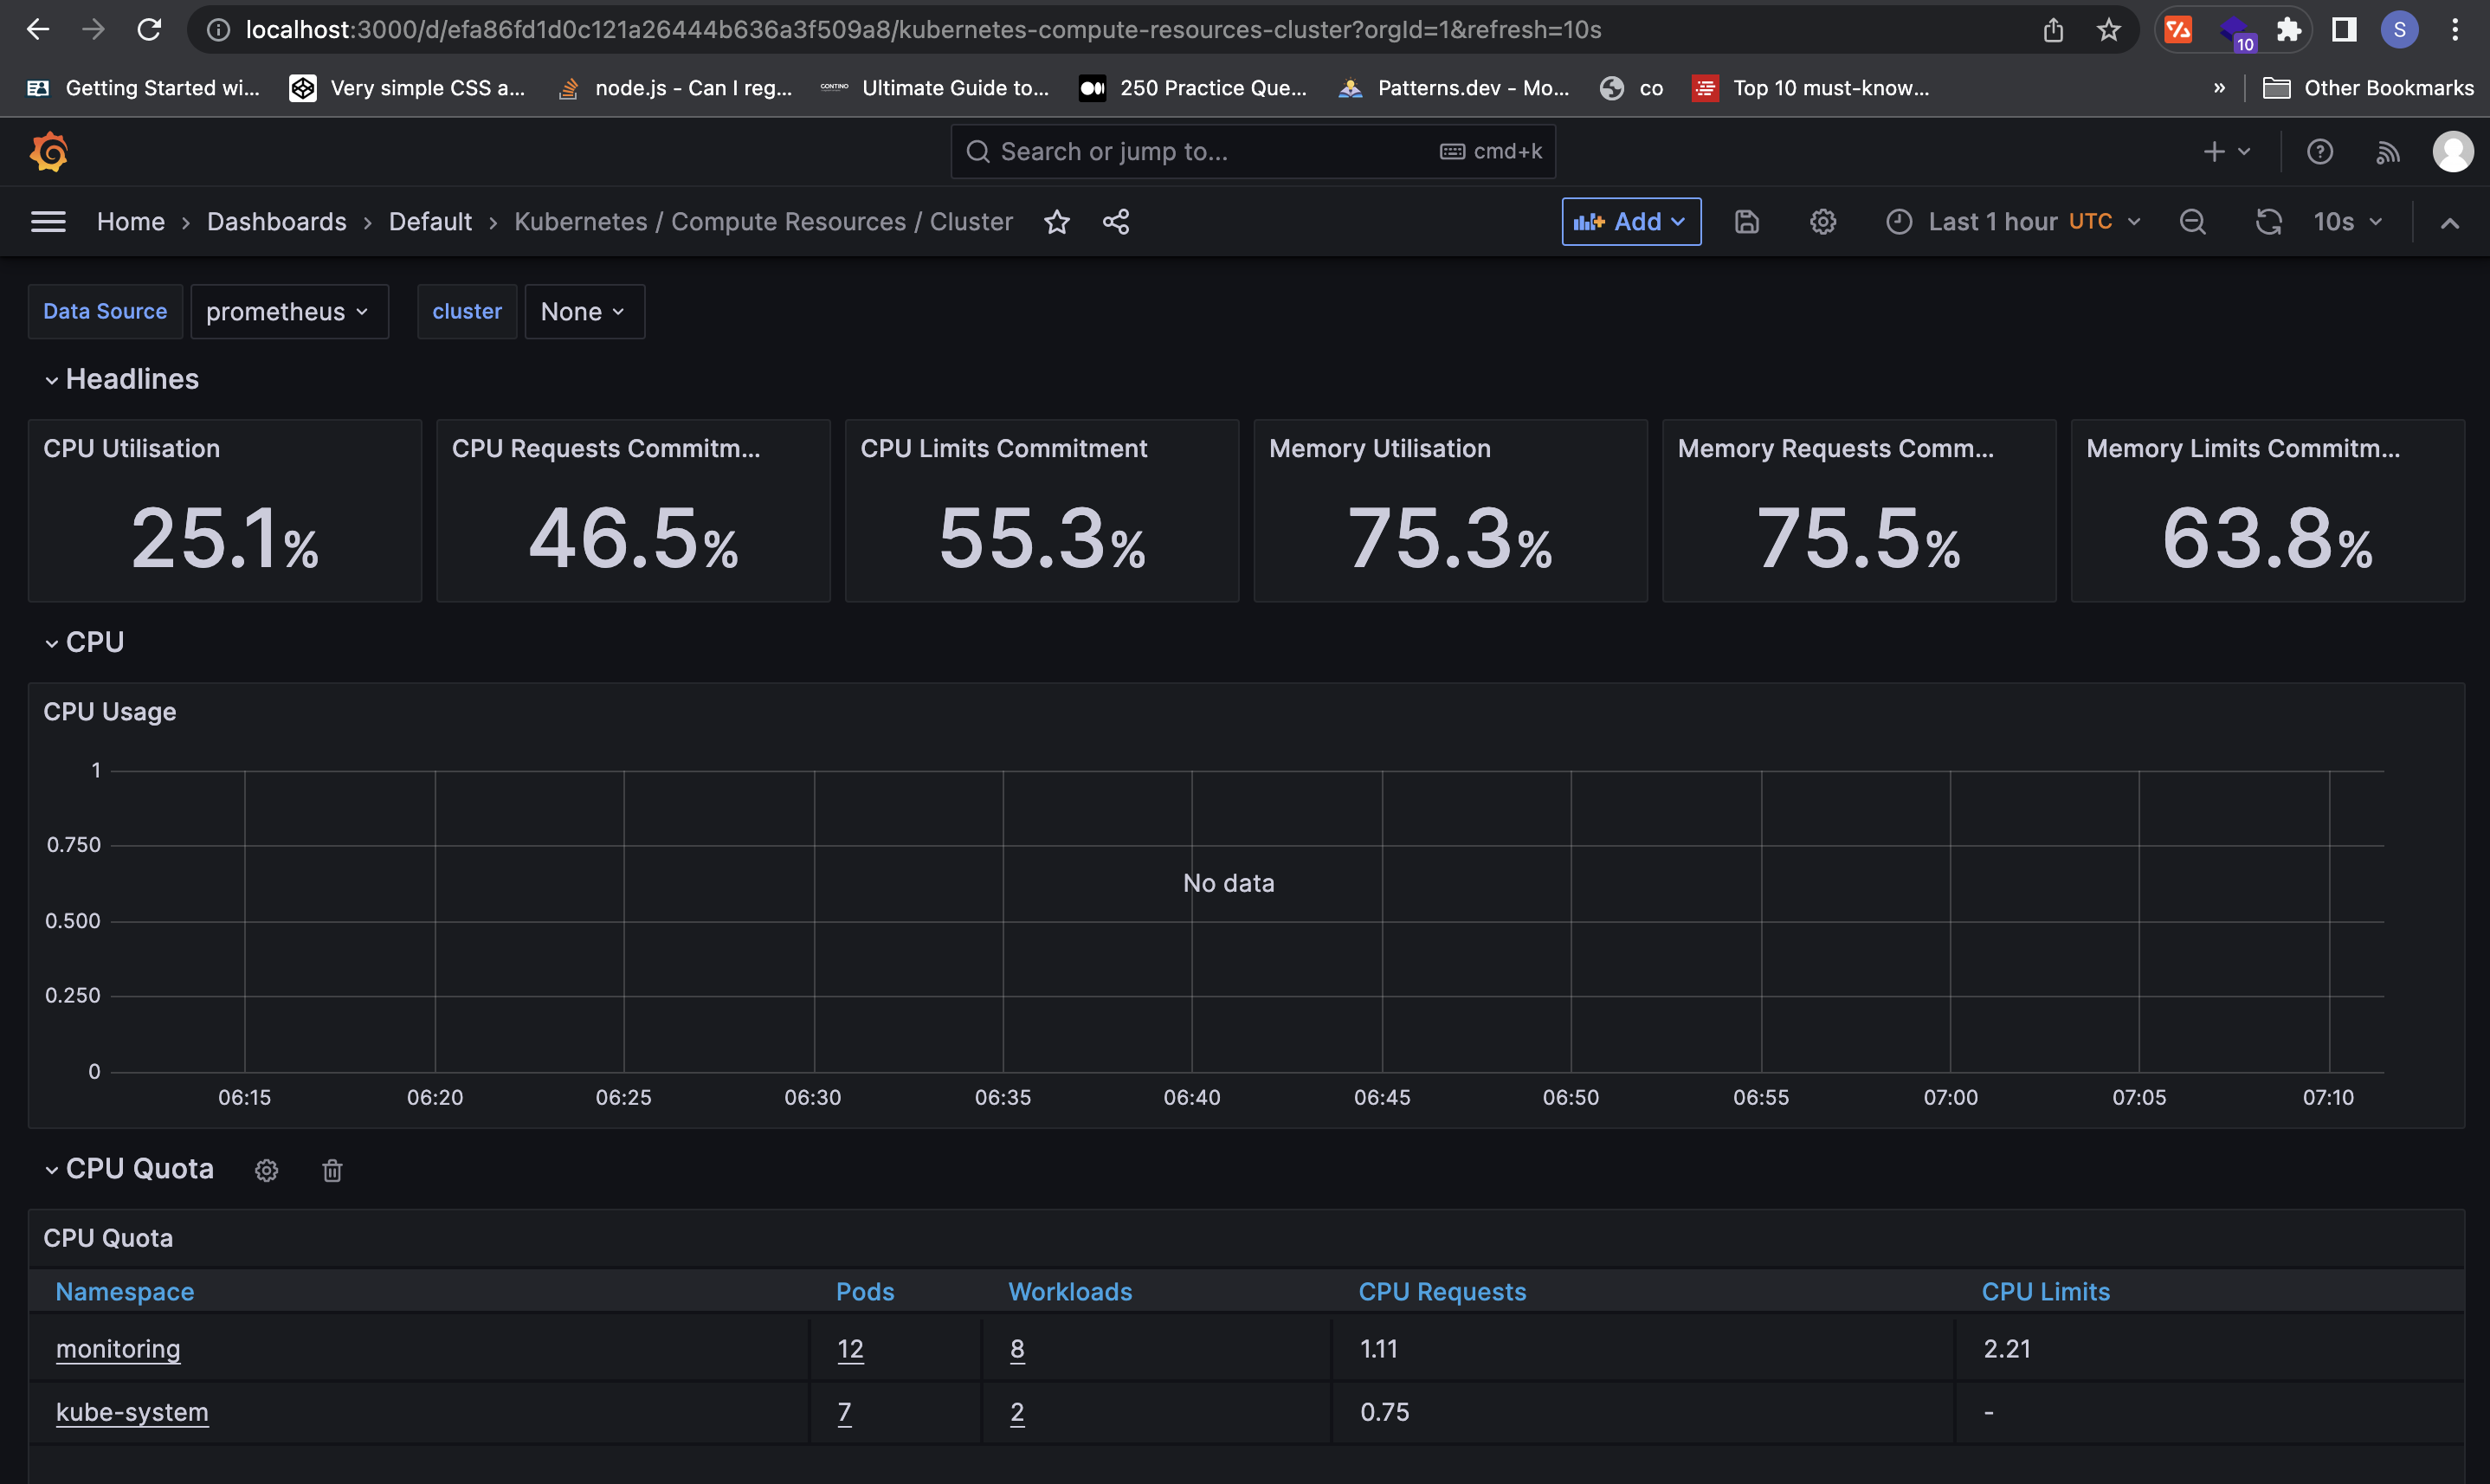
there are many dashboards available. Explore these dashboards, and you can monitor the cluster with these dashboards.
- Kubernetes / Compute Resources / Namespace (Pods)
- Kubernetes / Compute Resources / Namespace (Workloads)
- Kubernetes / Compute Resources / Node (Pods)
- Kubernetes / Compute Resources / Pod
- Kubernetes / Kubelet
We can pull our own application metrics to Prometheus, which we can discuss in the next blog.