We have previously delved into numerous observability and monitoring stacks. Now, let's explore Grafana Mimir 😃 - its purpose, significance, and the scenarios in which we employ Grafana Mimir.
What Grafana Mimir ?
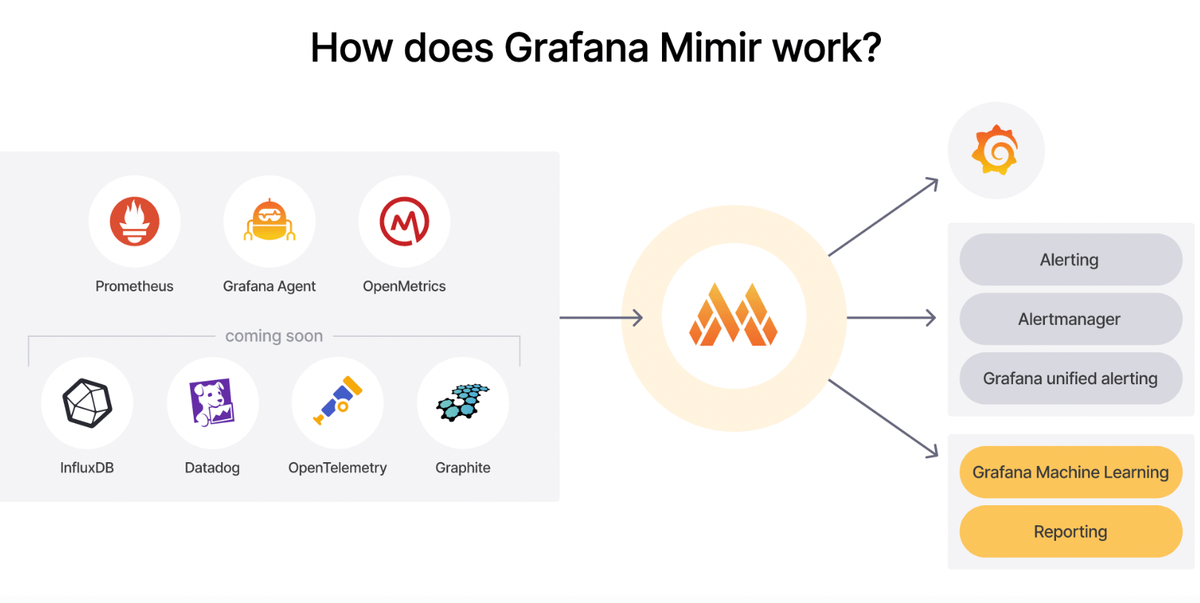
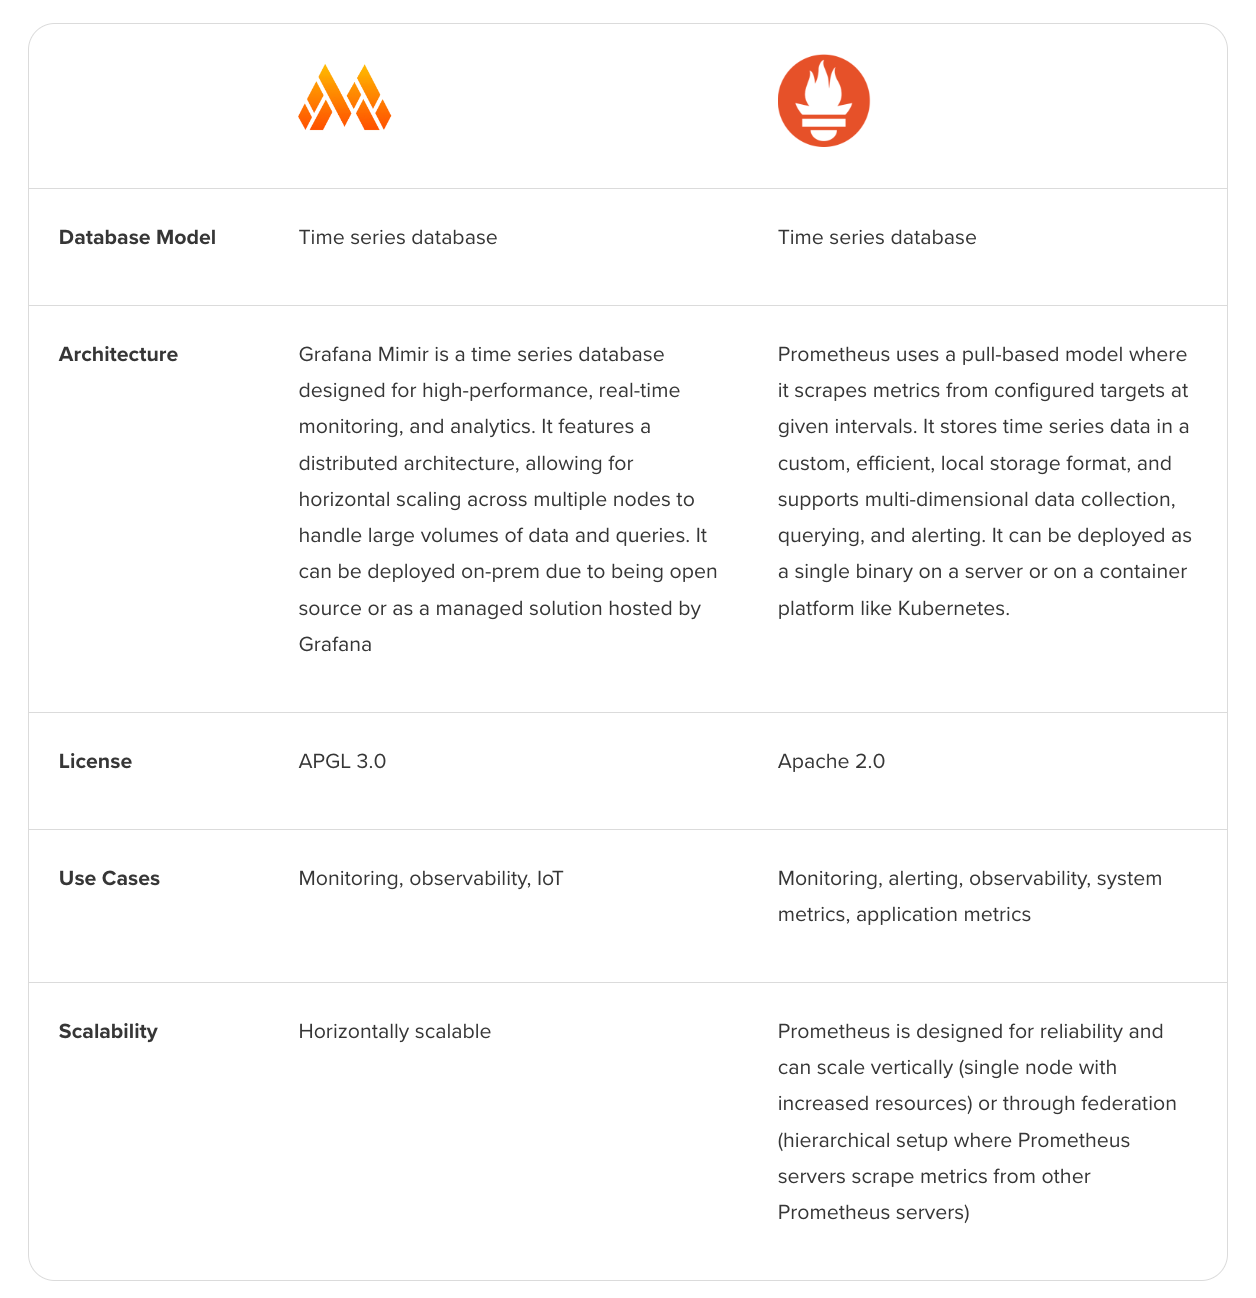
Grafana Mimir, introduced by Grafana Labs in 2022, is an open-source project designed with the primary goal of establishing a scalable, multi-tenant, and highly efficient open-source time series database specifically crafted for metric data. Mimir functions as a time series database for metric-type data, utilizing the familiar PromQL query language for data retrieval. Acting as an intermediary between Prometheus and Grafana, Mimir plays a pivotal role in enhancing the interaction and functionality between the two.
Why Grafana Mimir ?
Why Grafana introduce Mimir ?, we have already Prometheus, right ?, Yeah Prometheus, has limitations, that’s why Grafana Labs introduced Mimir.
Mimir and Prometheus both are time series databases. It provides long-term storage capabilities for Prometheus, With Grafana Mimir, users can store and query time series metrics over extended periods, allowing for historical analysis and trend detection. It is especially useful for applications that require scalable and performant storage of time series data for metrics monitoring and observability purposes.
Deploy Grafana Mimir
We can deploy Grafana Mimir in multiple ways, by using helm, puppet and sonnet and Tanka, here I am using Helm Chart, it is the easiest way.
Pre-requirements
- A single Kubernetes node with a minimum of 4 cores and 16GiB RAM.
- Kubernetes 1.20 or higher - kubectl version given installed version.
- Helm command version 3.8 or higher - to get the installed version use the helm version command.
First, we want a new namespace to install Mimir, so creating a new namespace by following the command
kubectl create namespace mimir-blogabove command will create a new namespace "mimir-blog", check it's created by executing the following command and gives a list of namespaces.
kubectl get ns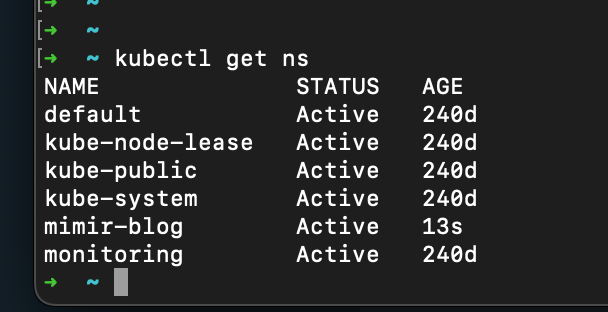
we are using Helm to install Mimir, so add Grafana char to helm
helm repo add grafana https://grafana.github.io/helm-charts
helm repo update
check helm chart is added, by executing the following command and will list a helm repos
helm repo list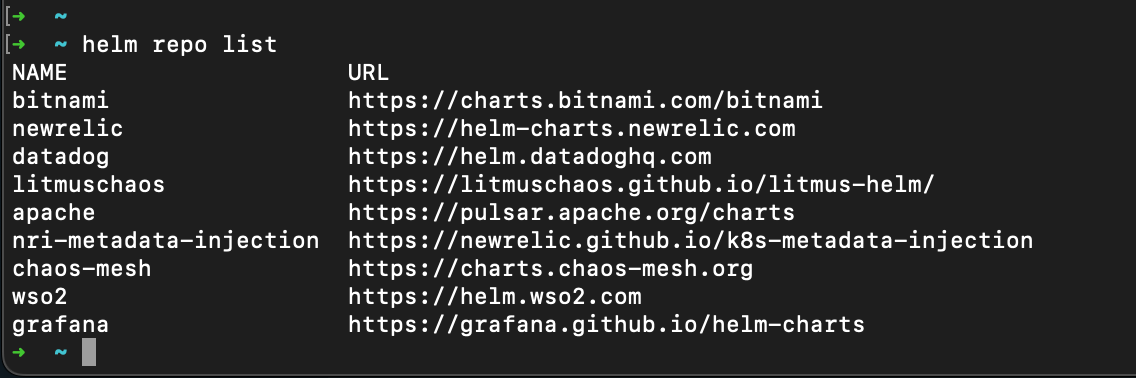
helm chart is added, so, we can install Grafana Mimir
helm -n mimir-blog install mimir grafana/mimir-distributedit takes some time to deploy, execute the following command to get the pod status
kubectl get pods -n mimir-blog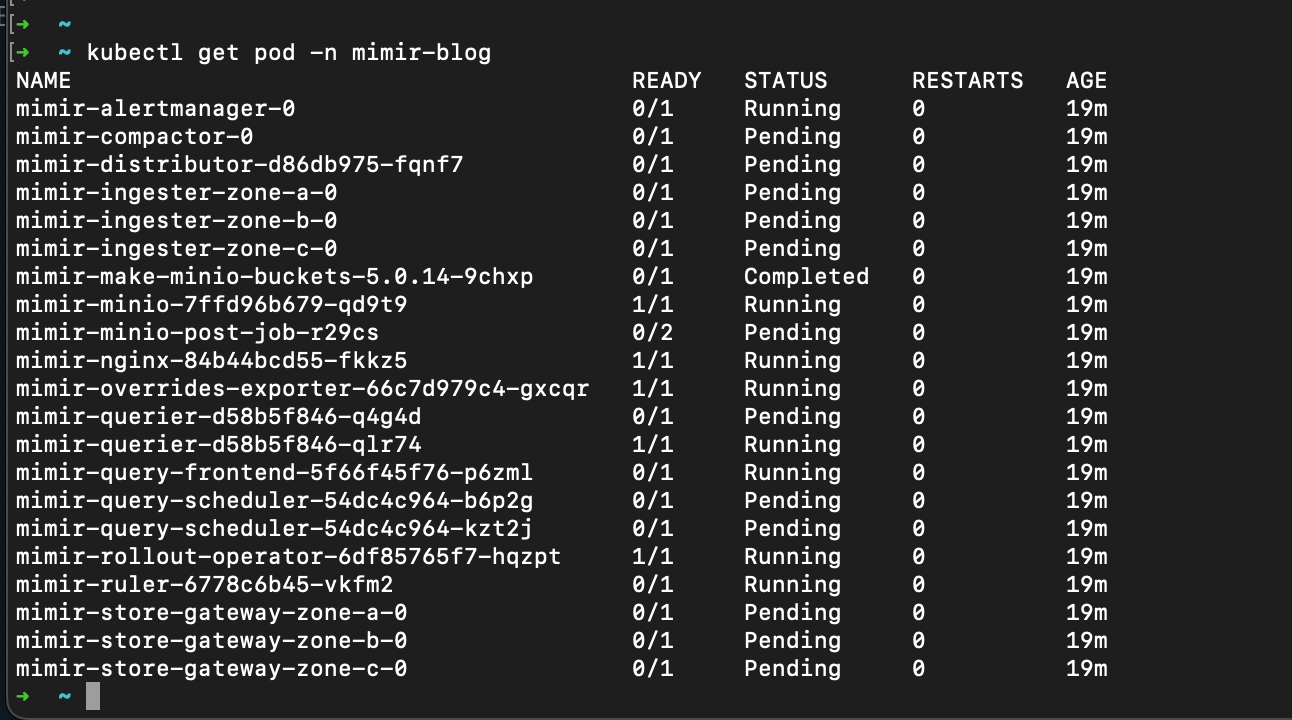
you will get an output like the above.
Grafana Mimir provides long-term storage capability. Mimir supports Prometheus, grafana agent and OpenMetrics. in furure Grafana plan to supports influxDB, datadog, OpenTelemetry and Graphite. In the next blog, we well discuss how connect Grafana and Mimir and query data.