In the previous blog post, we covered the deployment of Mimir. Now, let's discuss into the process of connecting to Mimir and querying its data.
Mimir utilizes the same PromQL language, so if you're familiar with PromQL, querying Mimir should be straightforward. In a previous blog post, we provided an in-depth discussion about Prometheus.
For visualizing the data, it's essential to connect Mimir to Grafana. The setup of Grafana has been previously discussed; you can refer to the blog post for detailed instructions. Mimir serves as a long-term storage solution for Prometheus, so add Mimir as a Prometheus connection.
Add Mimir Connection
To add a new Mimir connection, follow the steps outlined below:
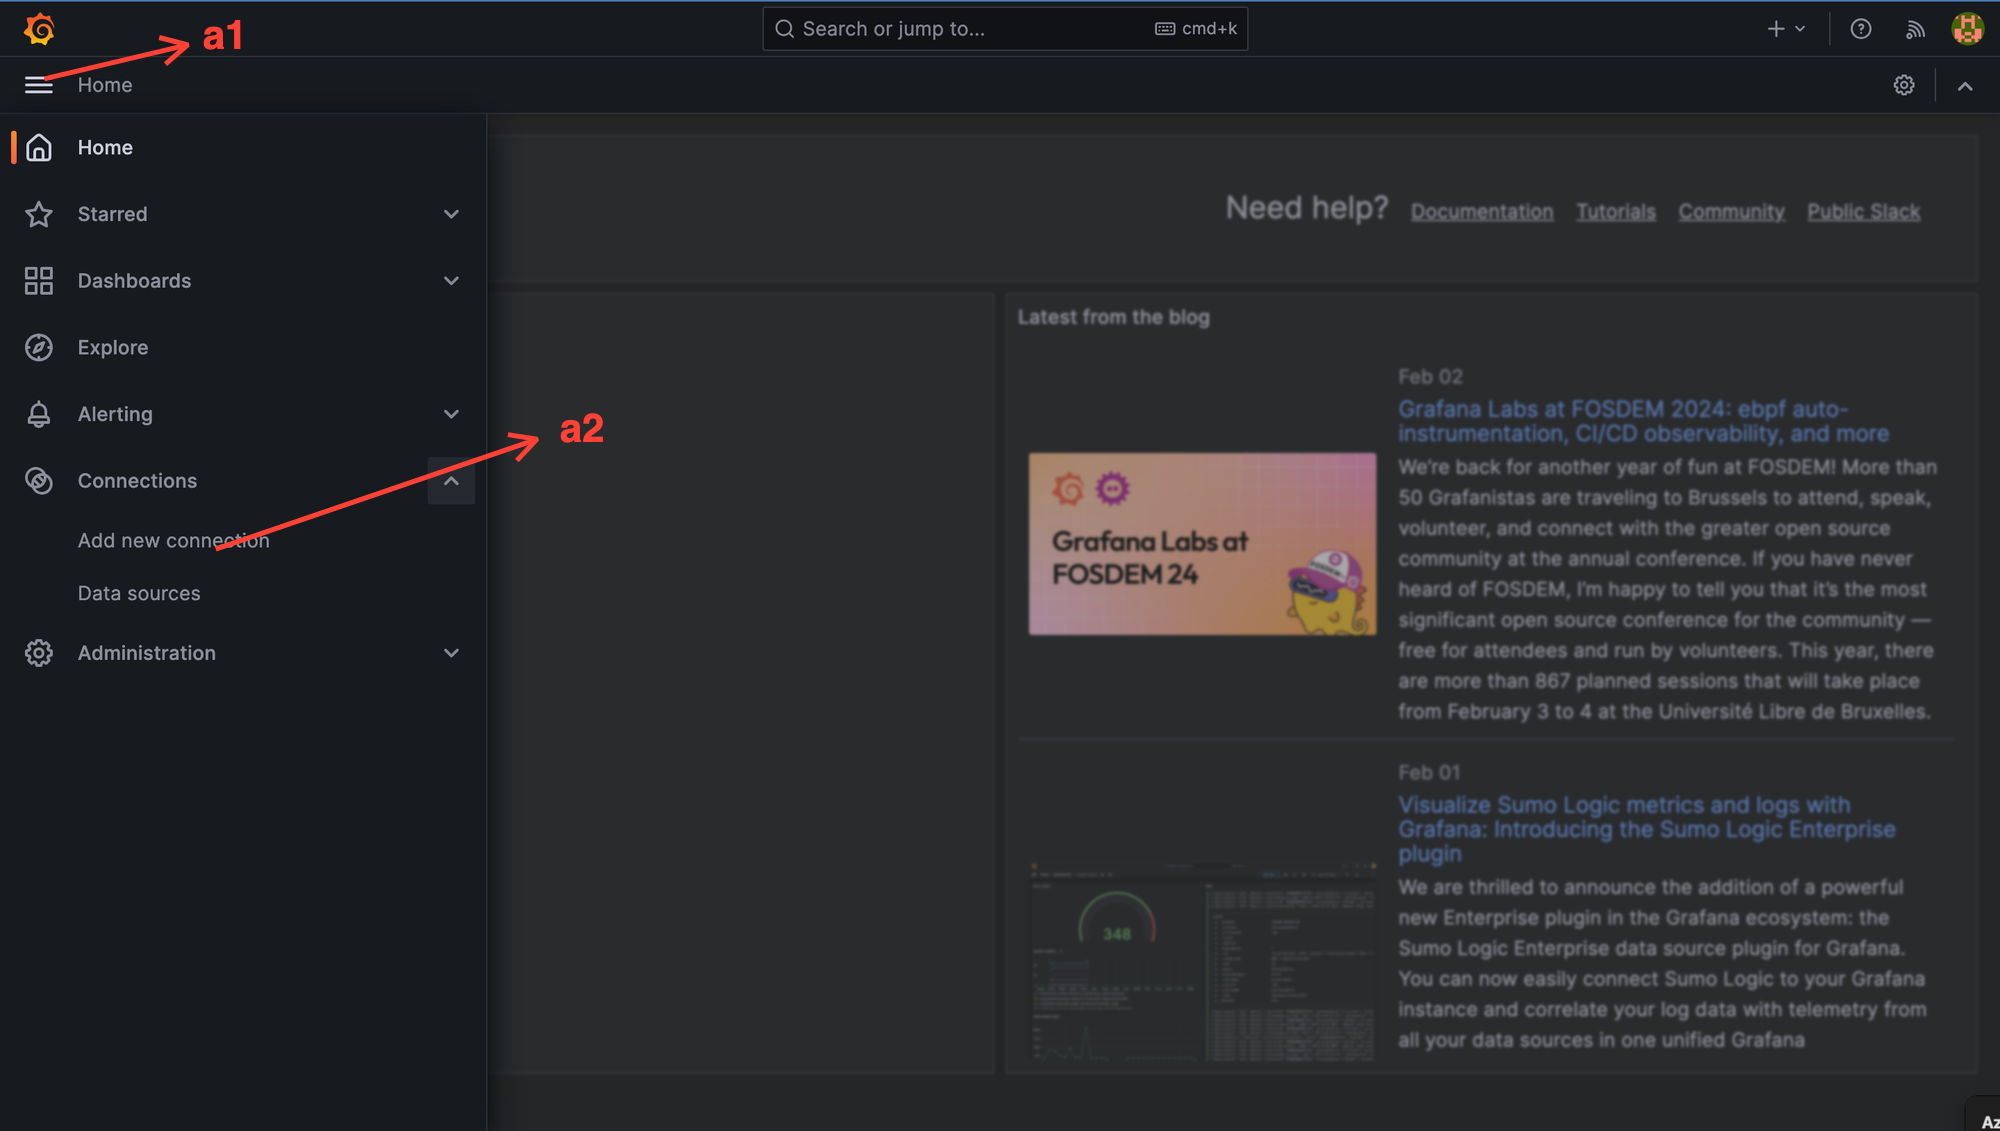
Step 1: Click on hump jumper menu (a1).
Step2: Click on 'New Connection' (a2), and after clicking, the menu below will appear on the screen and click on "Add New data source" Button (b1)
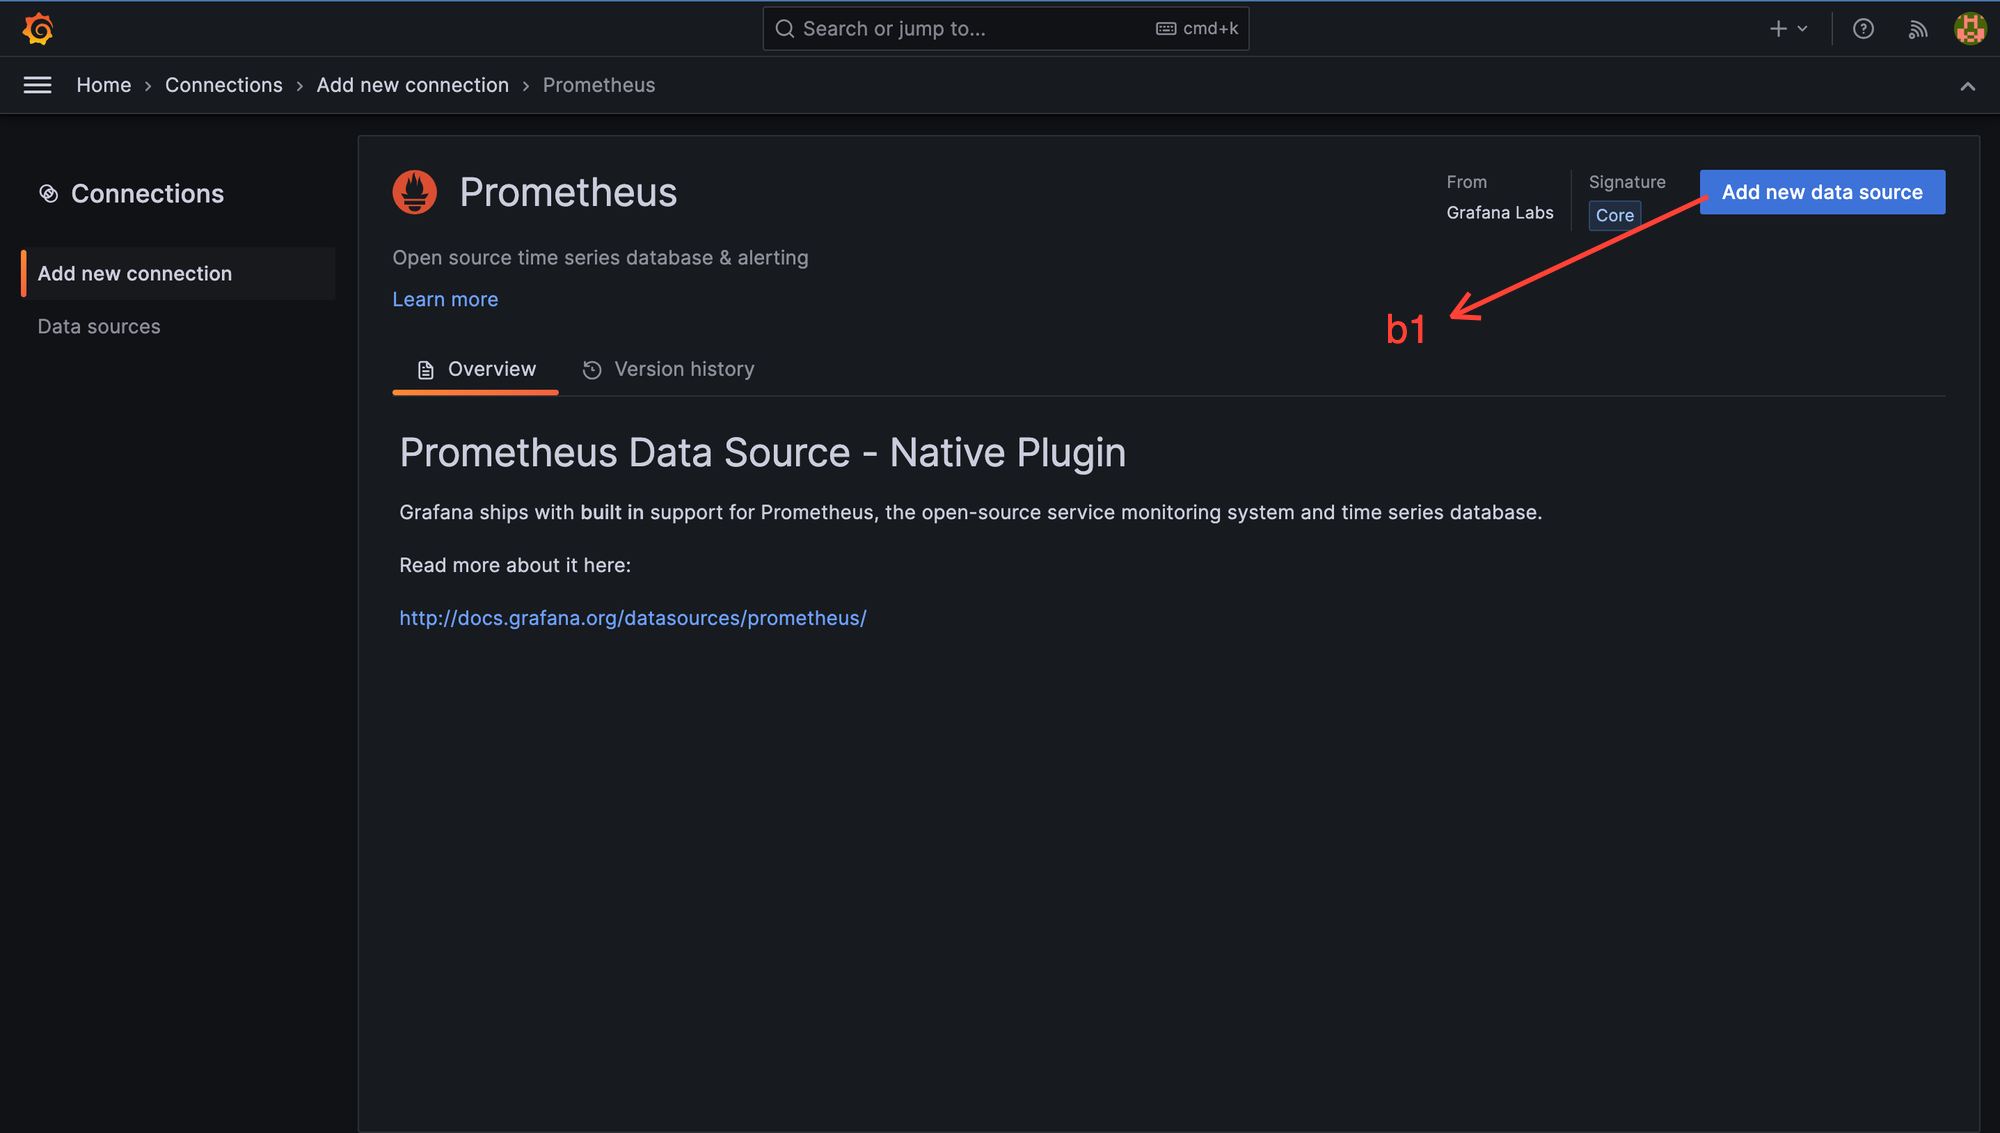
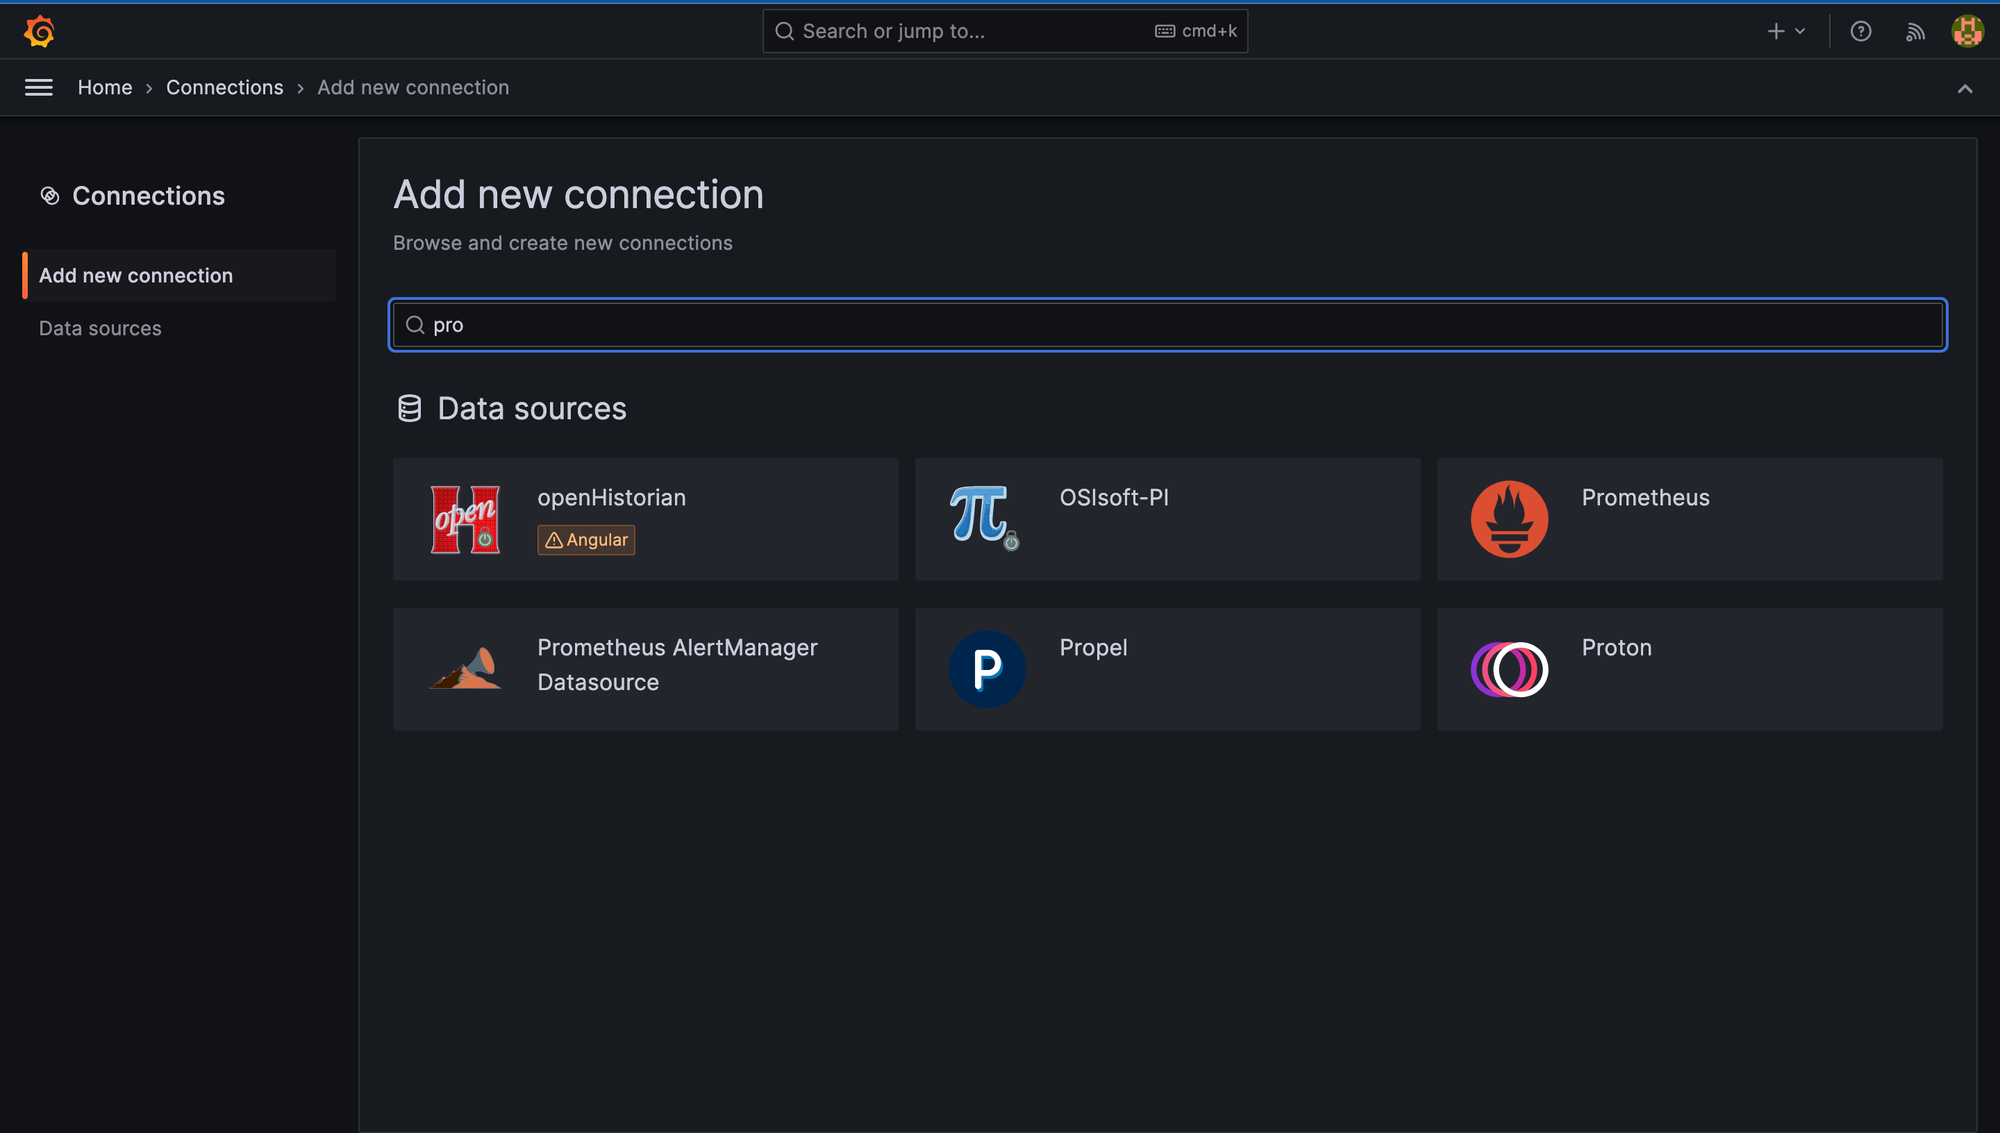
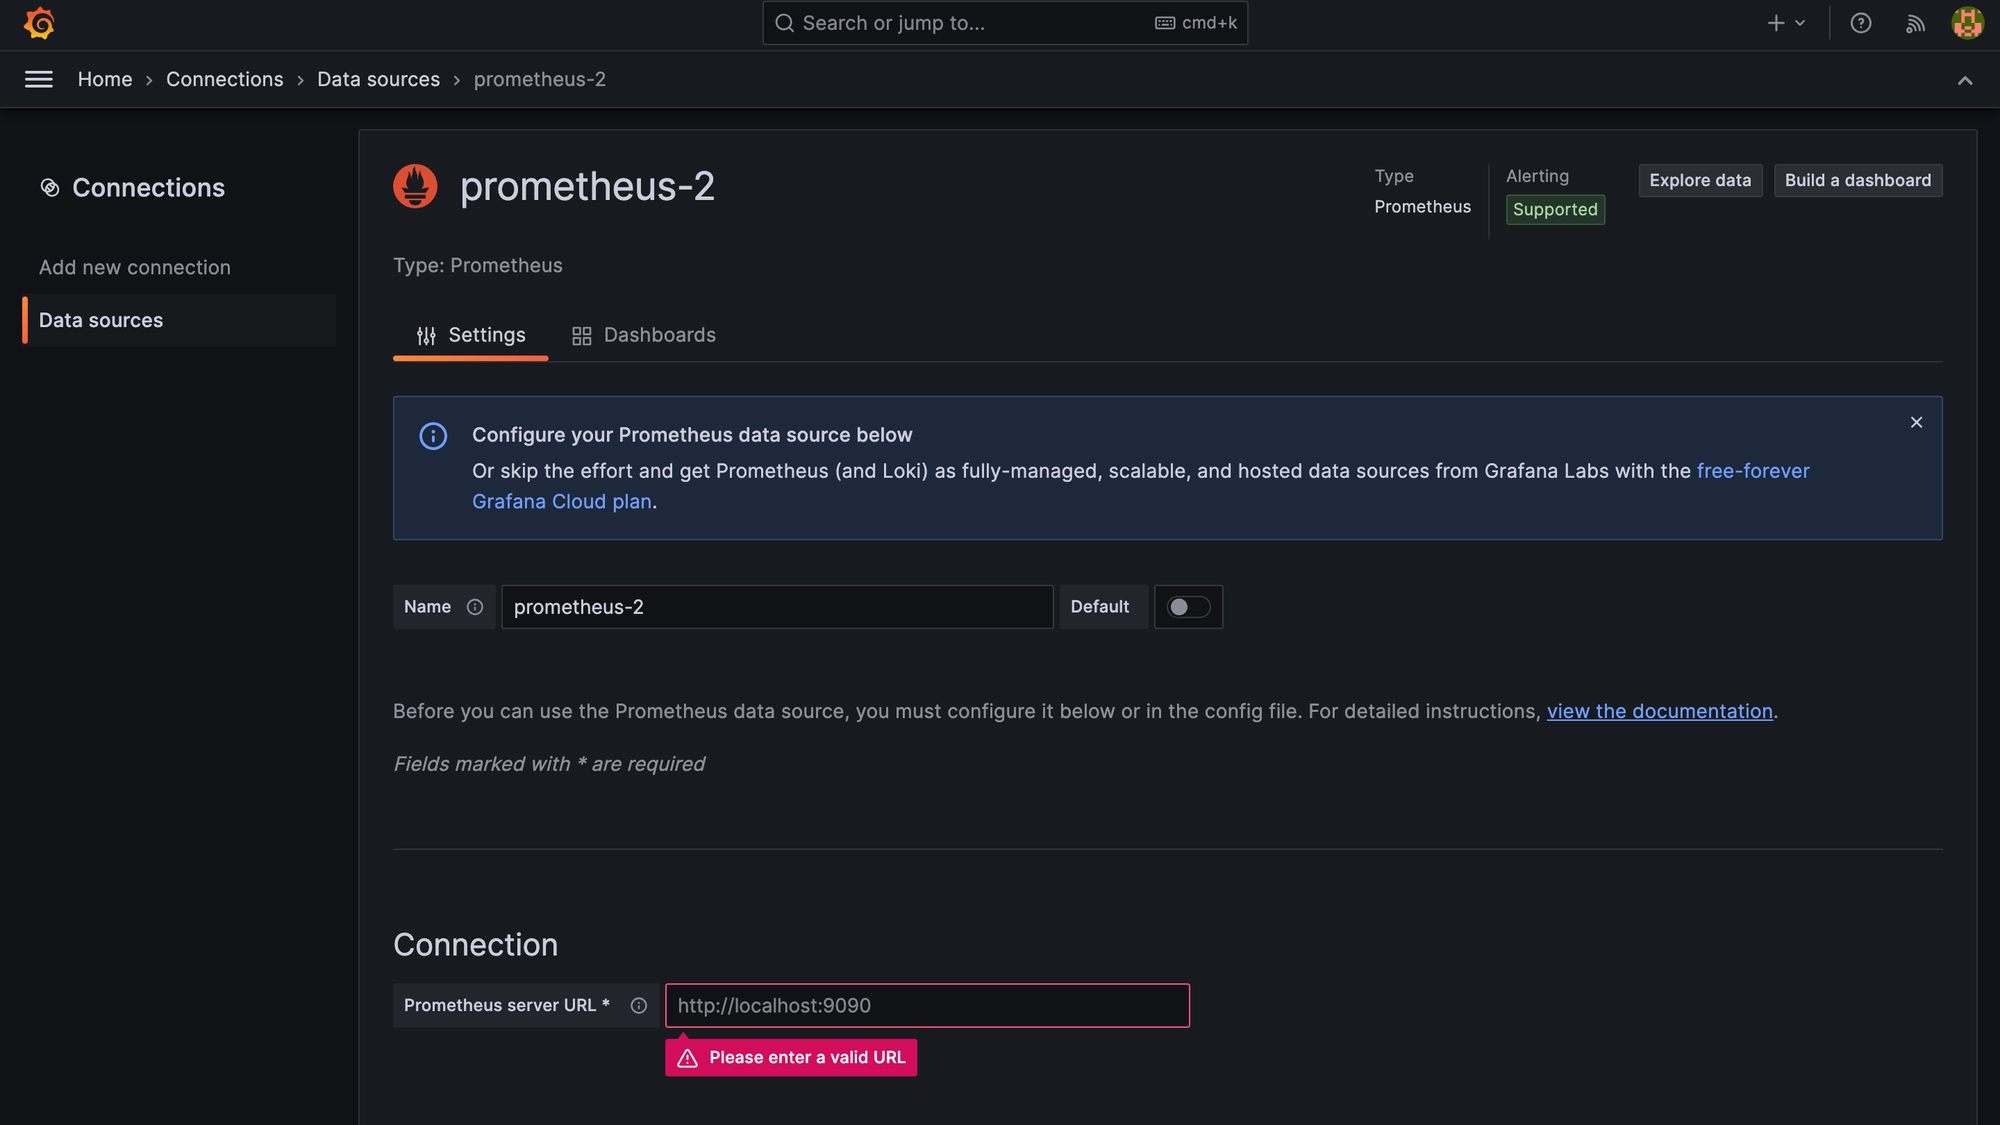
Step 3: Search for Prometheus and select the Prometheus card; you will be directed to the screen below:
Step 4: Select Prometheus and add following details. "Prometheus server URL" value is "http://localhost:9009/api/v1/push" and Click Save and Test Button.
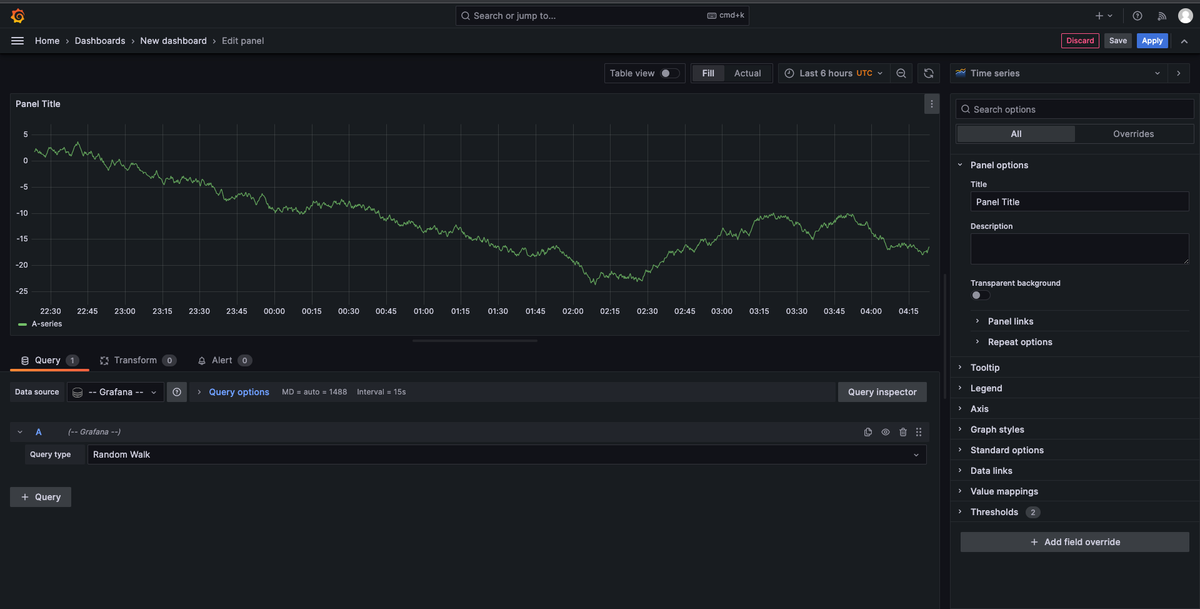
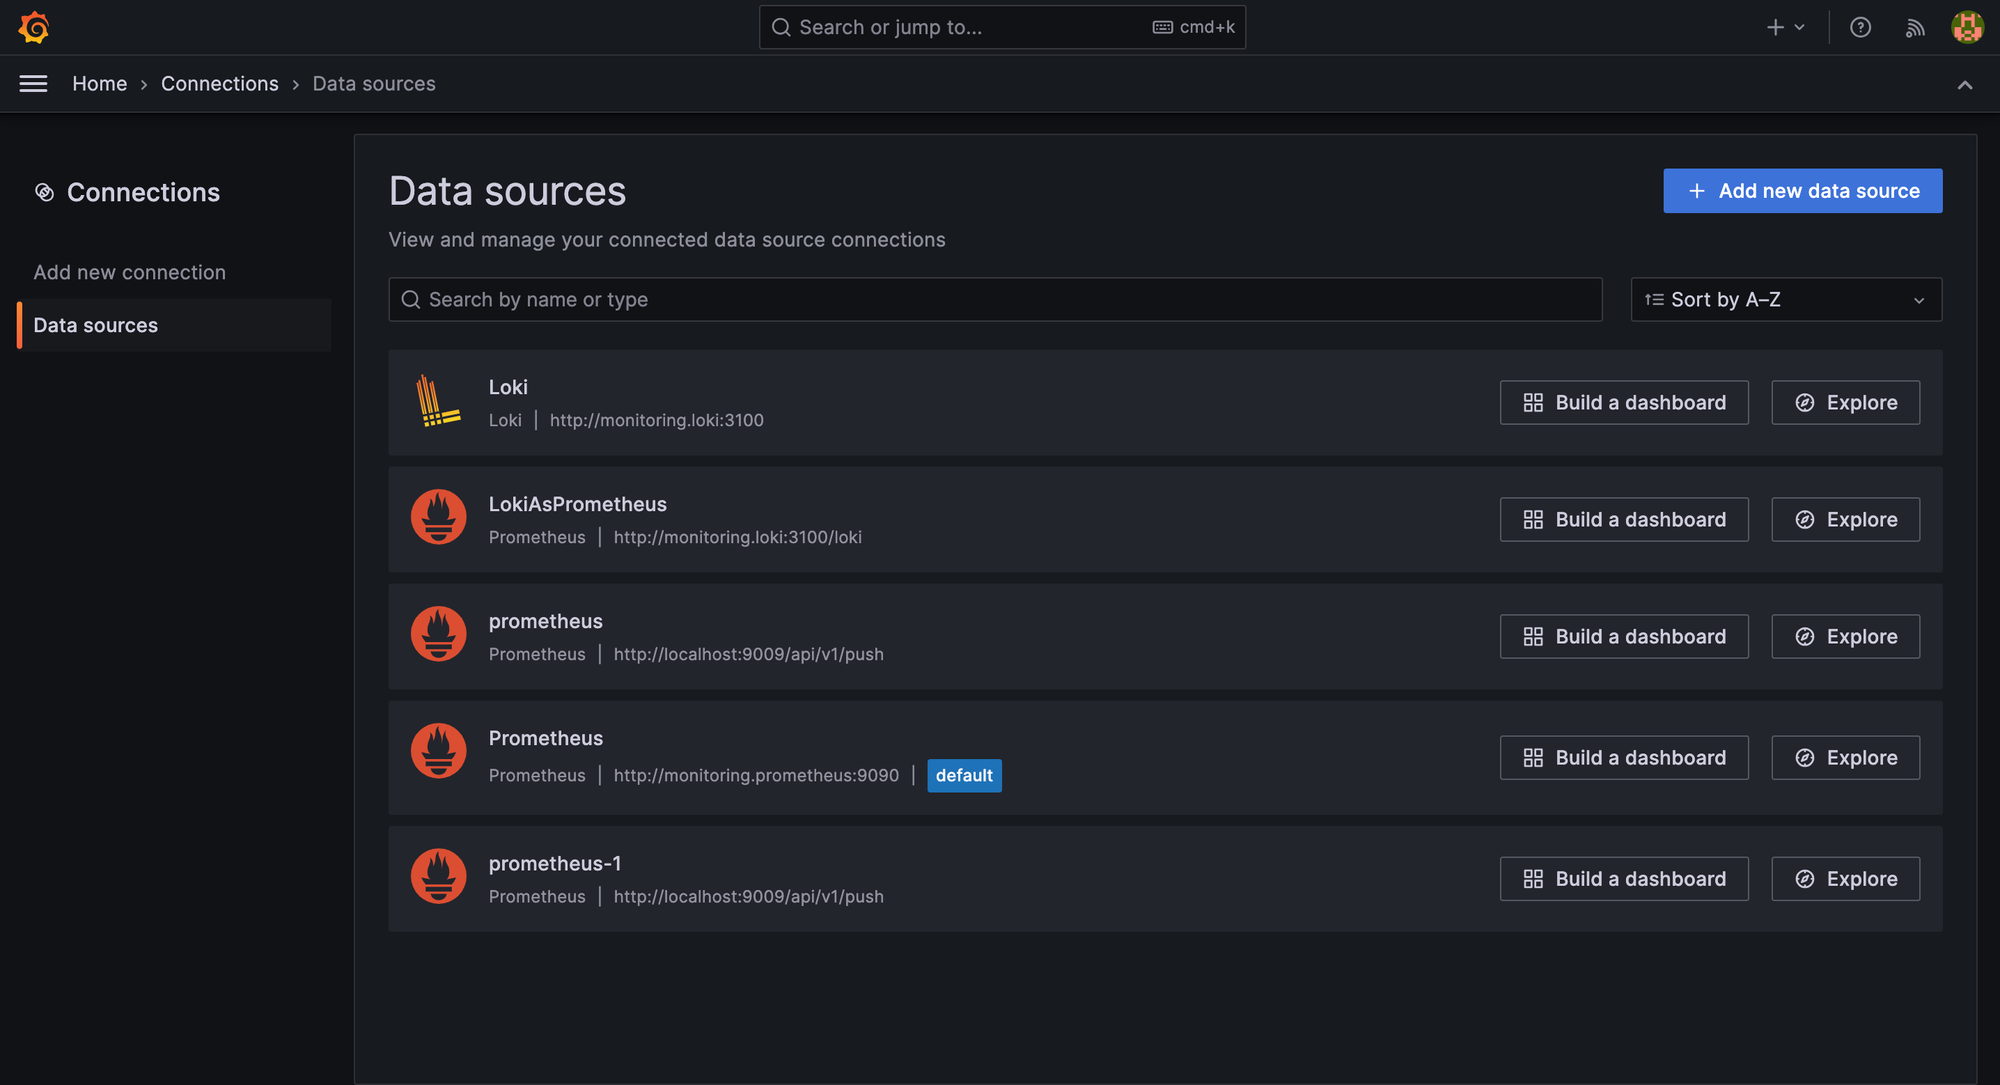
Step 5: After saving, the screen below becomes visible. By clicking the 'Explore' (c1) button, you can test PromQL queries and "Build a dashboard" to build Dashboard on the connector,
How to query PromQL ?
Yes, we have connected Mimir to Grafana. To test or explore queries on the data, we use 'Query Explore.' Here, you can experiment with and examine PromQL queries.
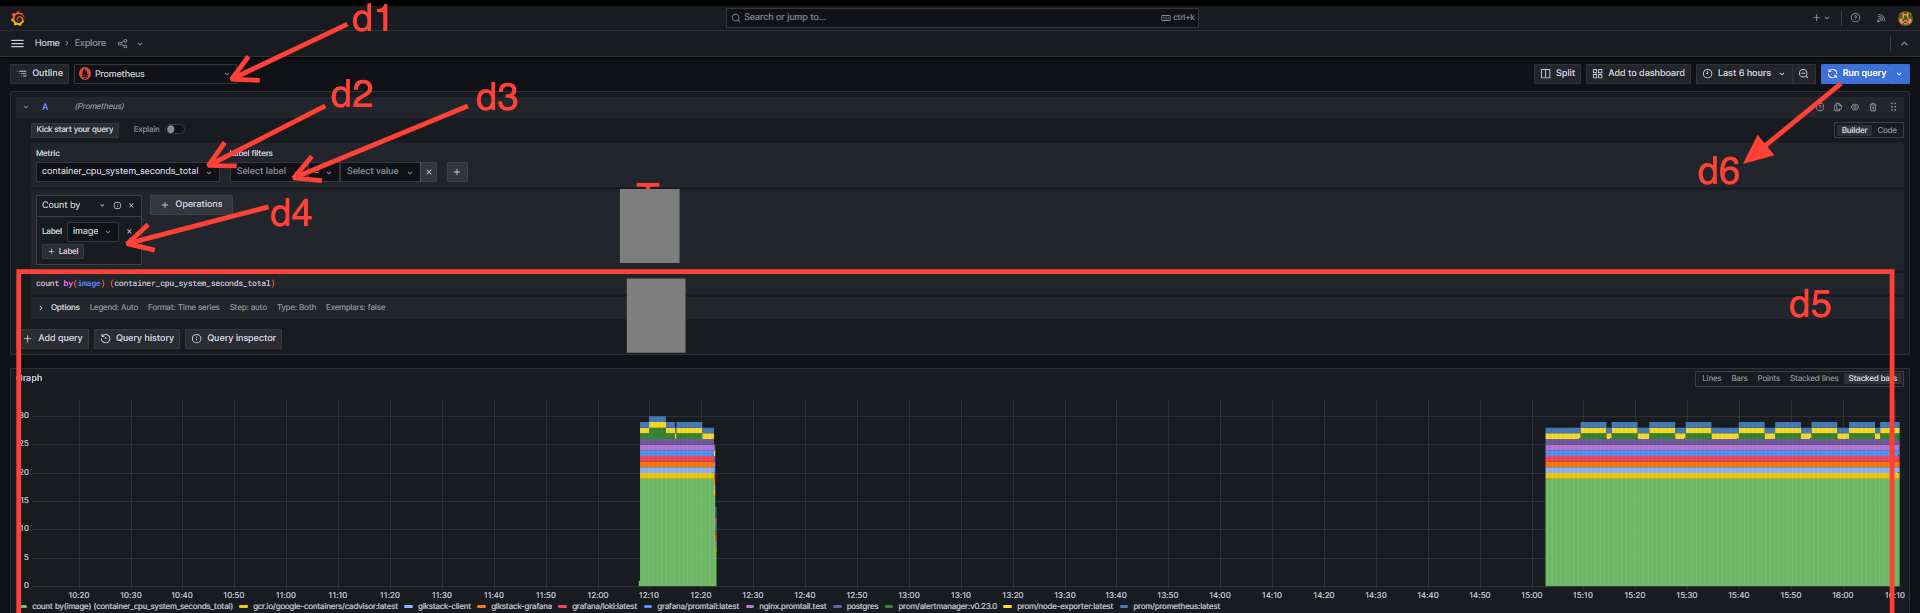
explore page as main 5 section.
1.Datasource: Choose the source data that you want to visualize
2.Metrics: The chart is generated based on the selected metrics
3.Filter: for filtering the filter metric data.
4.Operation: Operation refers to the application of mathematical or time functions on the data
5. Data Visualization : this final part, which visualize the data which we have filter and operated.
"Run Query" button helps to run builded query
Switch to builder to code mode and try following promql and run
count by(image) (container_cpu_system_seconds_total)
count by(code) (promhttp_metric_handler_requests_total)
Lets Create Dashboard
We've already learned how to query data using PromQL in the Explore section. Now, let's apply this knowledge to create a dashboard and visualize the data. Follow the steps below:
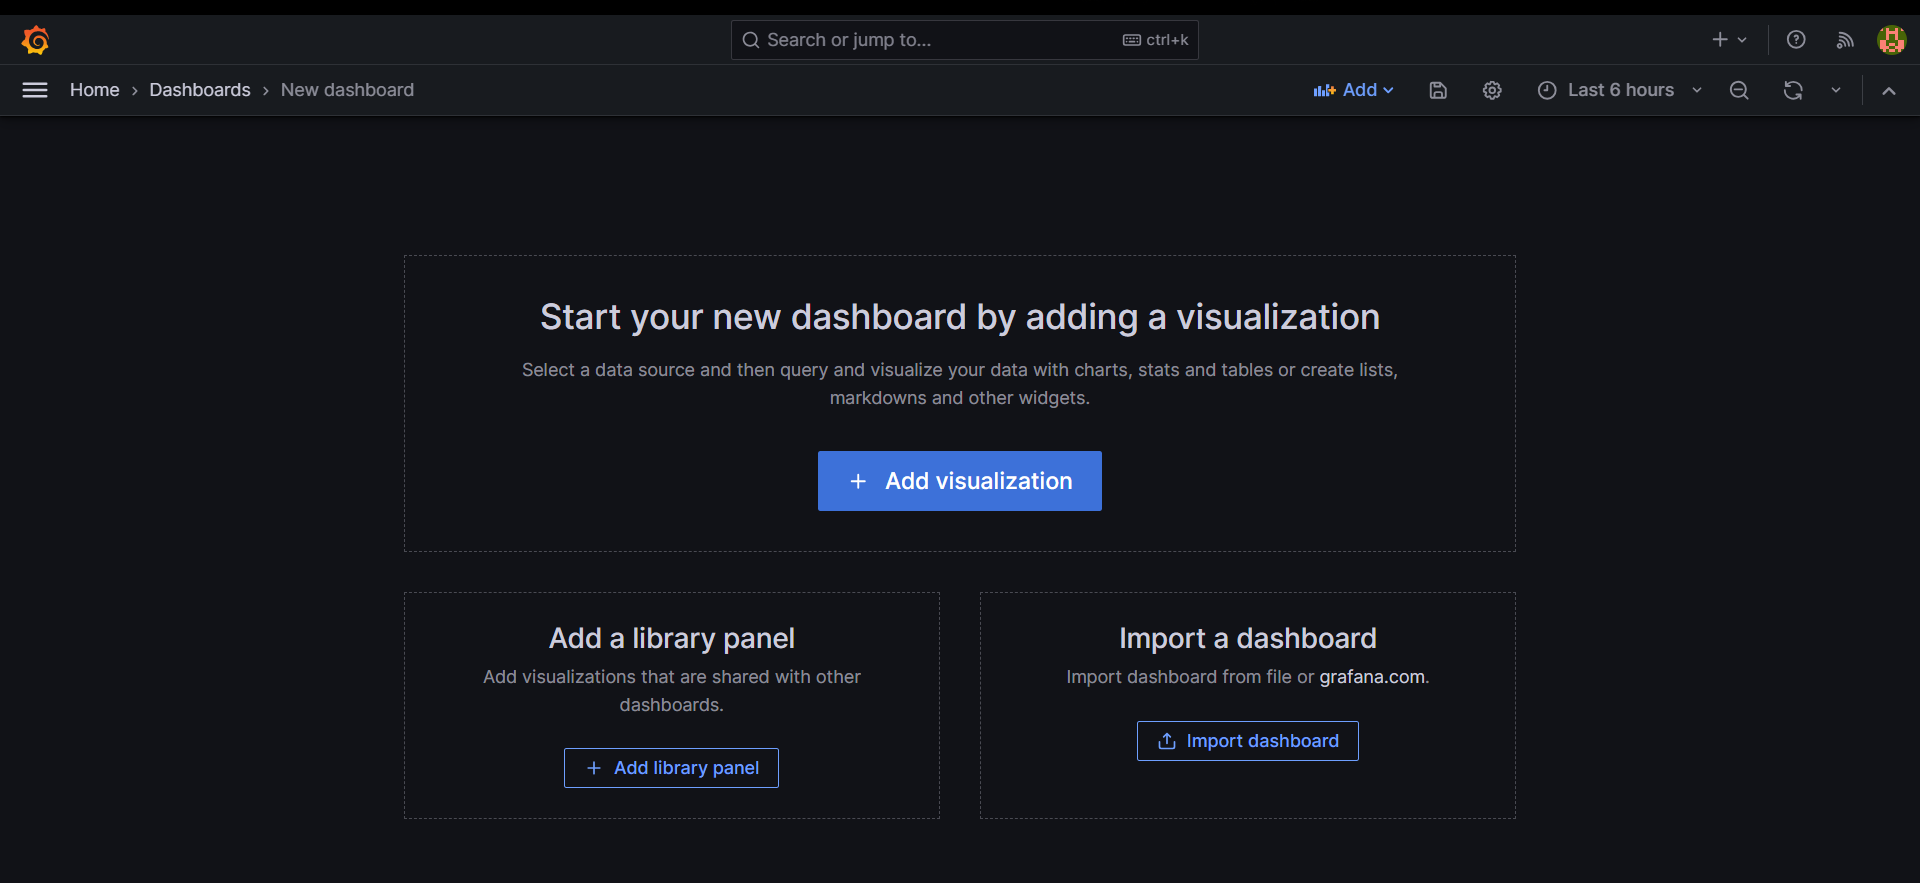
Step 1: Click on "Build a dashboard" button, then below screen will appear. Click new "New"Button ().
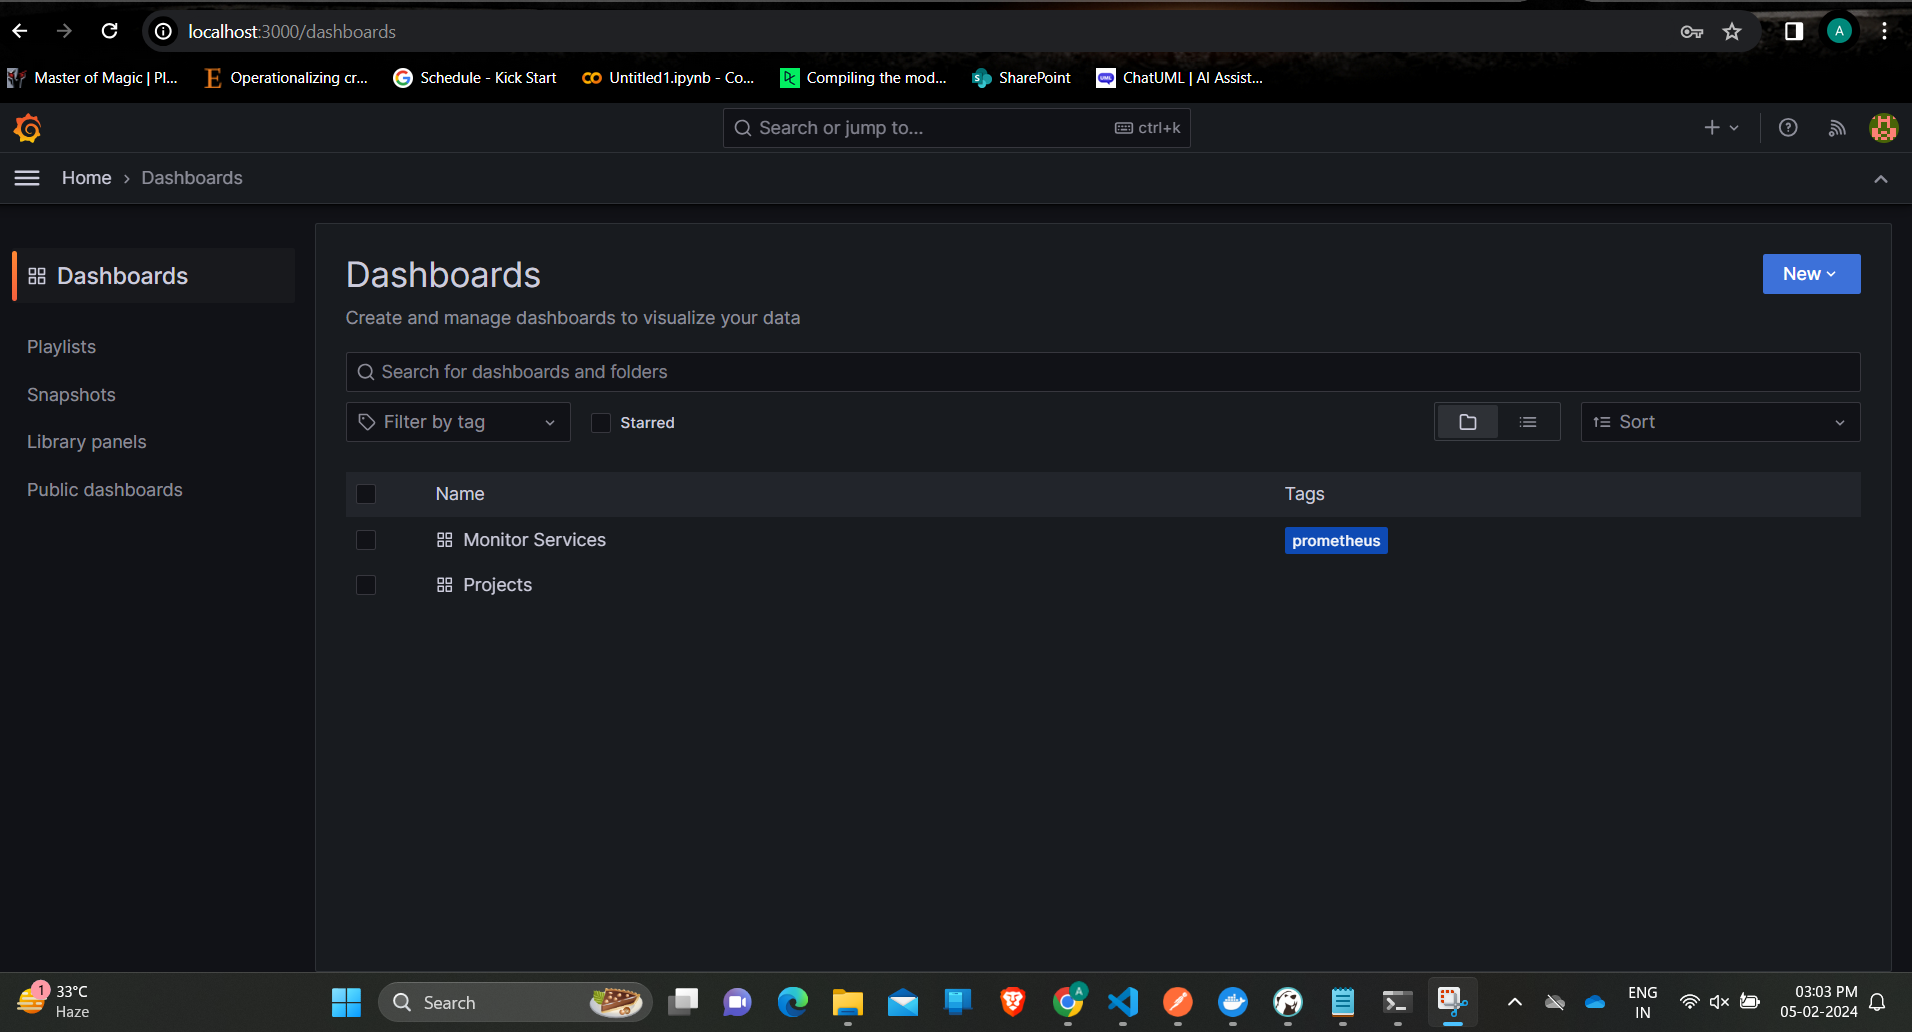
Step 2: Clicking on "New" will bring up the screen below, indicating that a new dashboard has been created. However, since there is no visualized data yet, you need to create a new chart or visualization. To do this, click on "Add visualization."
Step 3: create Gauge chart based in "http status code" ,
this screen has 3 parts
- Visualization Preview (part a)- shows the select chart or visualization preview based on the given data
- Visualization Properties (part b) - each chart or visualization has its own properties, which can change from this section
- Data (part c) - where promQL apply, filter and grouping are done by here
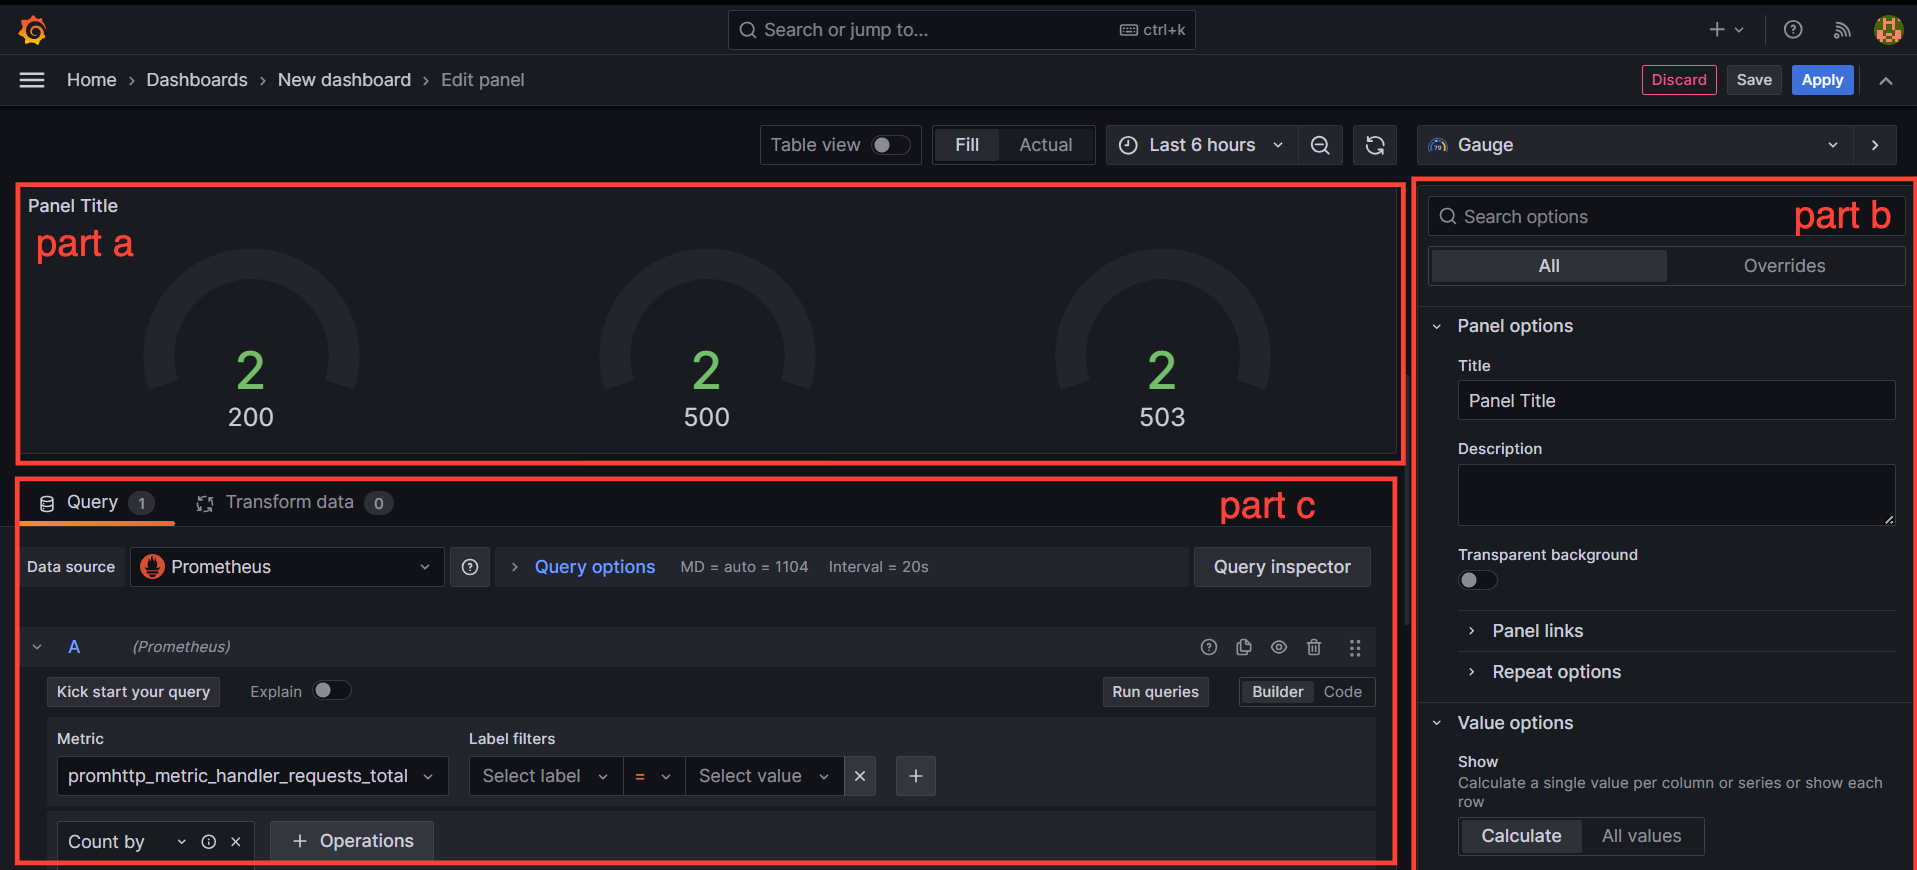
First, select the data source from the dropdown; in this case, choose prometheus. We are utilizing the 'promhttp_metric_handler_request_total' metric to generate the Gauge chart. Additionally, an operation has been added to count the HTTP request status codes.
Grafana offers a variety of visualization charts. Explore each chart type, add more charts, and create an awesome dashboard to monitor your stack. Additionally, there are many predefined charts available for your convenience.