In the last blog, we talked about Loki and how to set up a simple loki cluster. Let's run some queries inside the cluster now that it has basic Kubernetes logs going.
it's more similar to PromQL but with an added feature.
The query language LogQL is extremely user-friendly and effective and is used to analyze and query log data in a Loki system. We will look at LogQL queries with examples in this article in order to gain an understanding of how they operate and how they can be applied to log analysis.
Before writing your first LogQL Query, you must have a firm grasp of the following fundamental ideas:
- Log stream: a collection of log messages generated by a single source, like a server or an application.
- Label: A key-value pair that offers information about a log message's metadata. Labels are used to filter and group log data.
- Timestamp: Log generation time.
LogQL syntax
A logQL query is made of a log selector. and one or more expressions along with aggregation functions. In a logQL query expressions are separated by "|" symbol. Aggregation functions aggregate text data into plotable time series and summaries.
In general, this is the LogQL query syntax
<log_stream_selector> | log_pipeline< <filter_expression> <parsing_expression> <formatting_expression> <drop_expression> >Mainly there are 2 parts Log stream selector and Log pipeline. the Log selector identifies the logs you wish to search or aggregate., while the Log pipeline can be appended to a log stream selector to further process and filter log streams. A Log pipeline is composed of a series of expressions. Each expression is executed in left to right manner.
Log stream Selector
In general, a log stream selector is a group of label matches combined using "," operator
here is a sample selector query
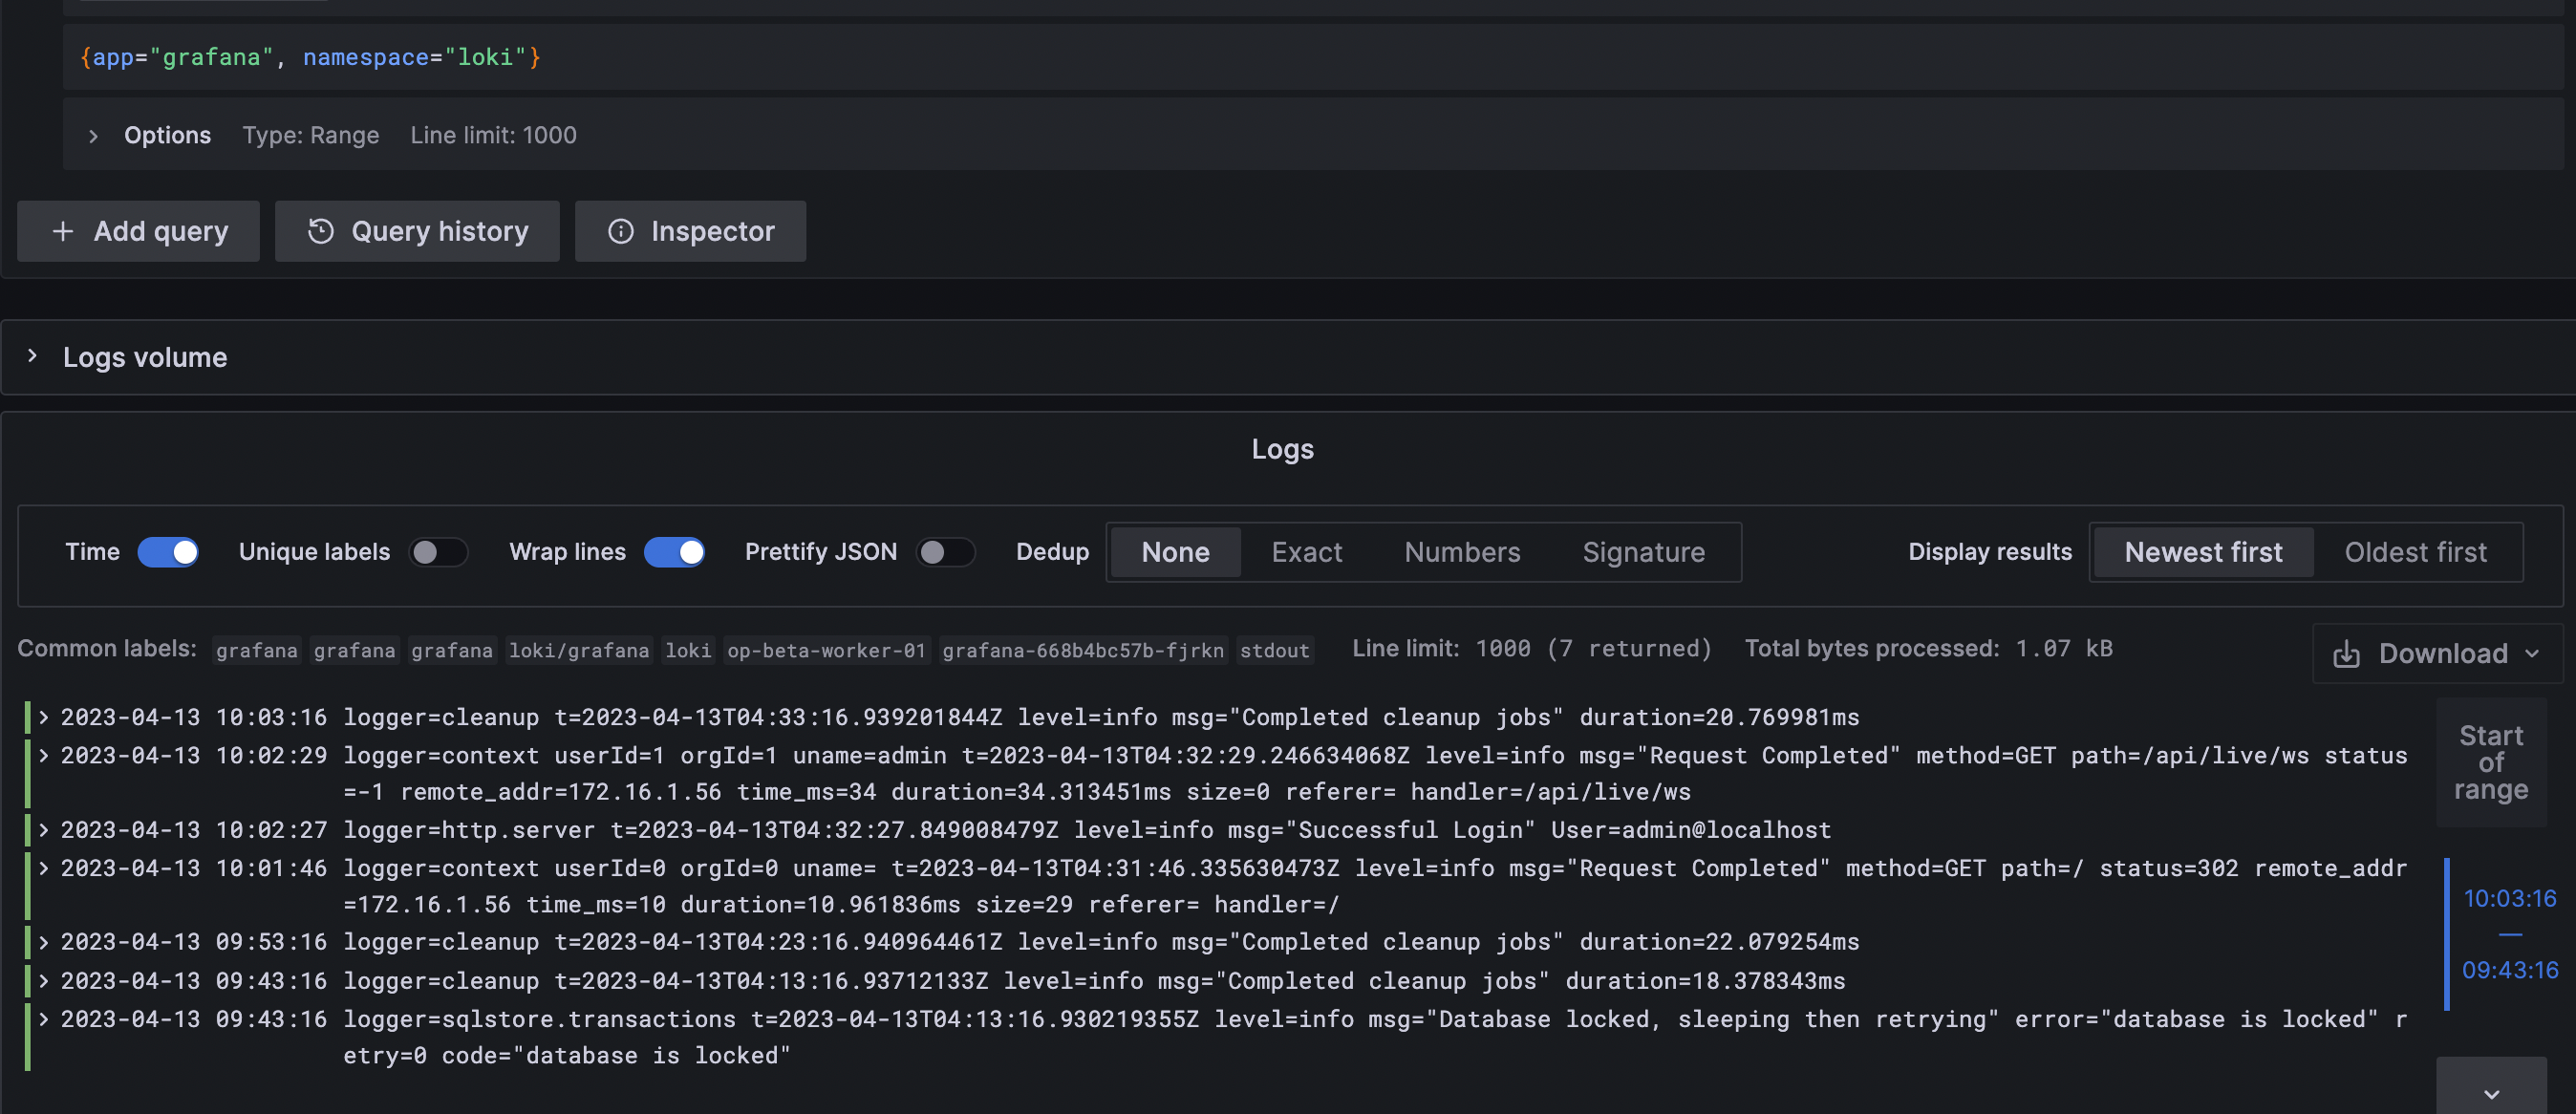
{ app = "azure", namespace= "loki" }this selector matches the log stream with namespace equals "loki" and "app" equals "loki". let's execute the query in the Loki which we set up on the last blog.
As the LogQL is inspired by PromQl, we can use Prometheus label-matching operators here as well.
- = exactly equal
- != not equal
- =~ regex matches
- !~ regex does not match
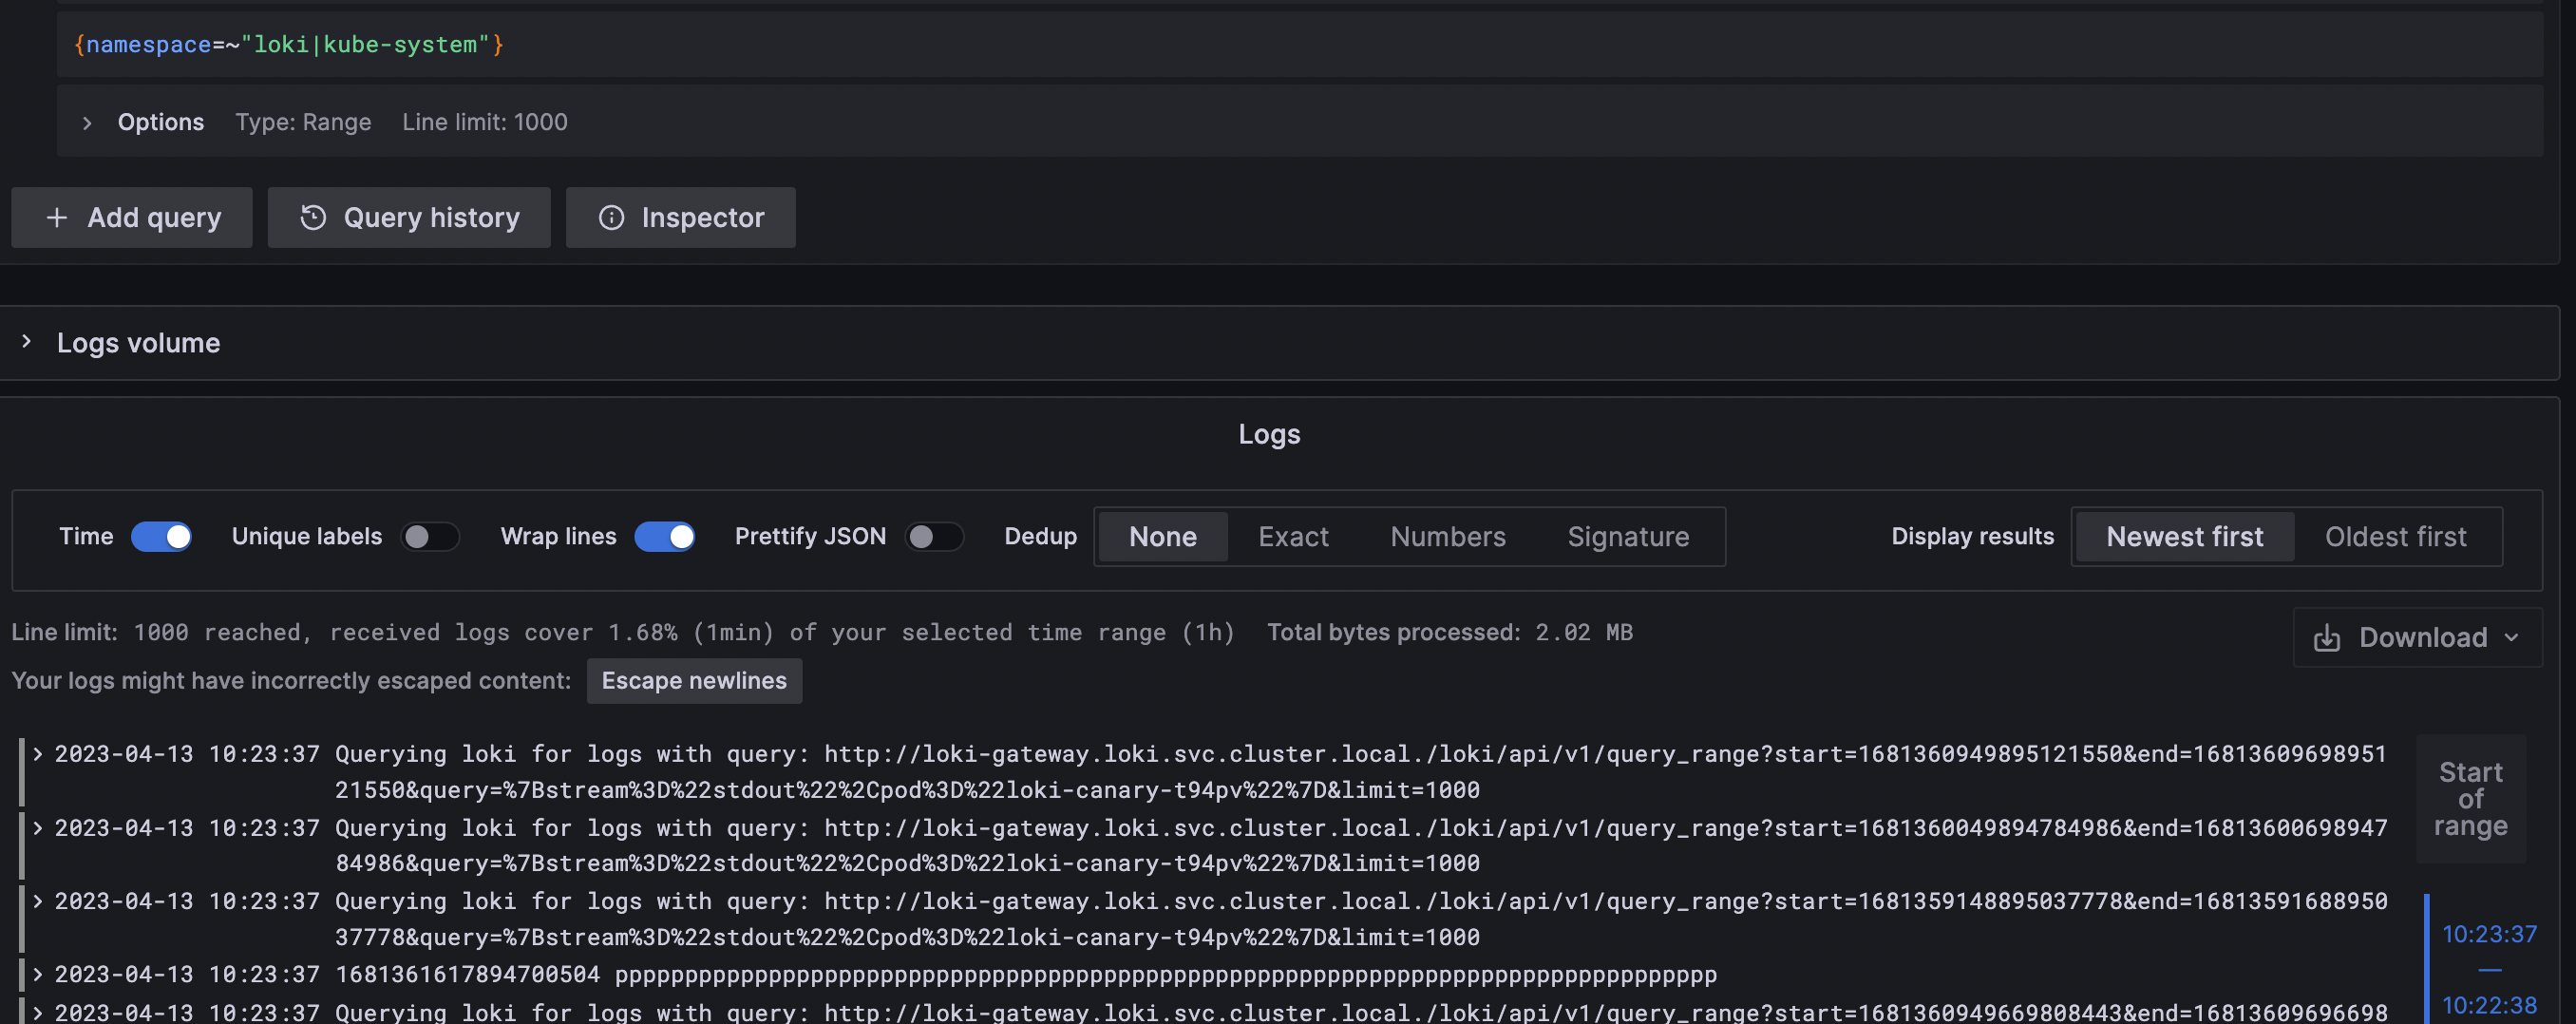
let's try a query with regex
{ namespace=~"loki|kube-system" }this regex filters out log streams where the label namespace equals "loki" or "kube-system"
Log pipeline
To further process and filter log streams, a log pipeline can be added to a log stream selector composed of several expressions.
Mainly there are 5 type of expressions
- Line Filter expressions
- Parsing expressions
- Label Filter expressions
- Formatting expressions
- Label drop expressions
Parsing expressions
Parser expression can parse and extract labels from the log content. these extracted labels can then be used for filtering using label filter expressions or for aggregations.
Loki supports the following parsers
1. JSON
Adding `| json` to your pipeline will extract labels from a valid JSON log line. For example, we can take this sample JSON log
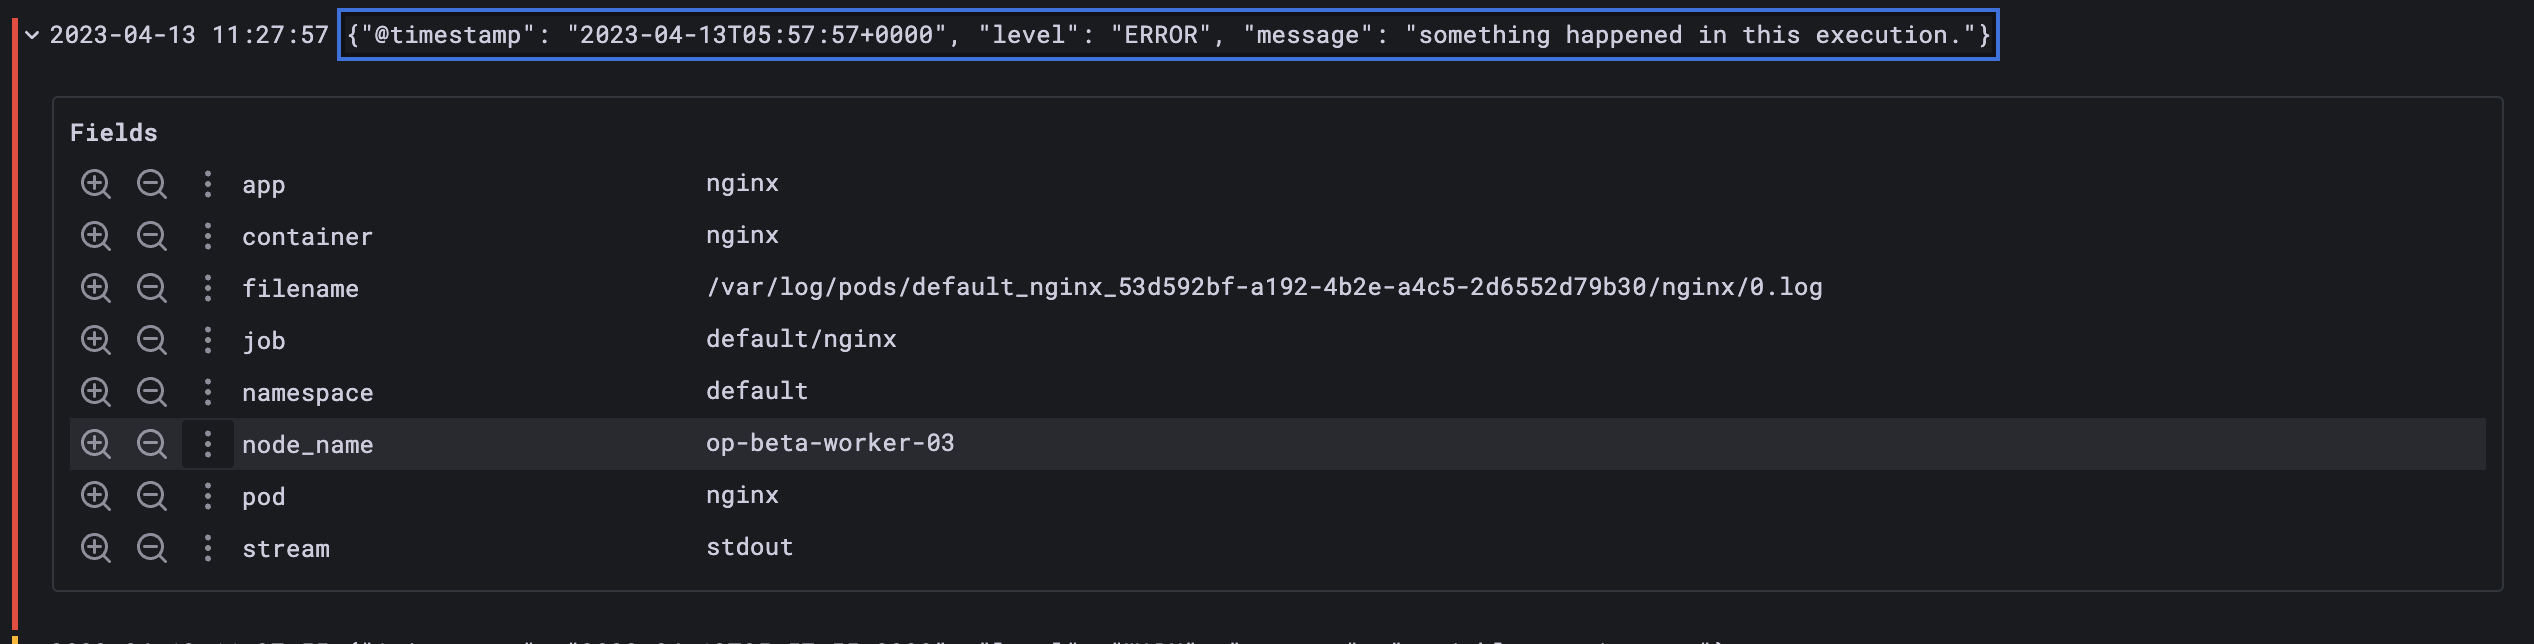
Executing the query will parse the log line into labels{ app = "nginx" } | json
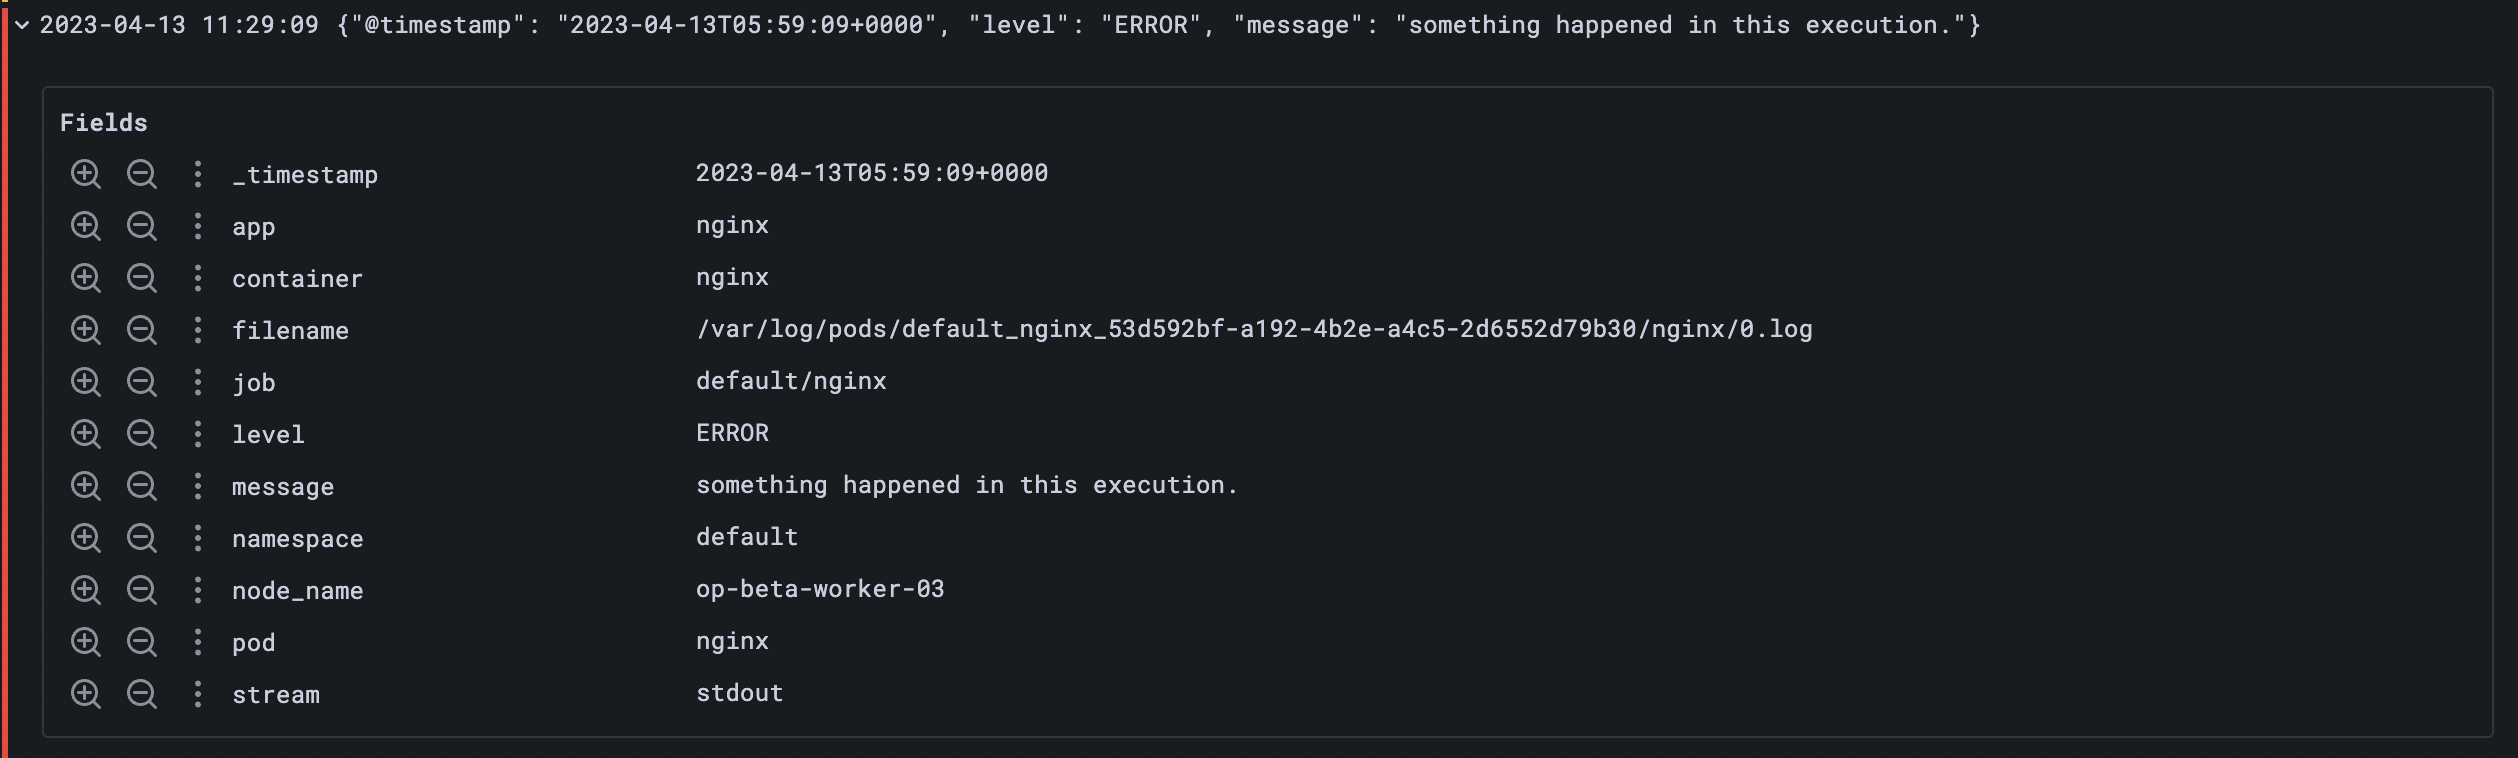
As you can see extra labels were added from JSON log
2. logfmt
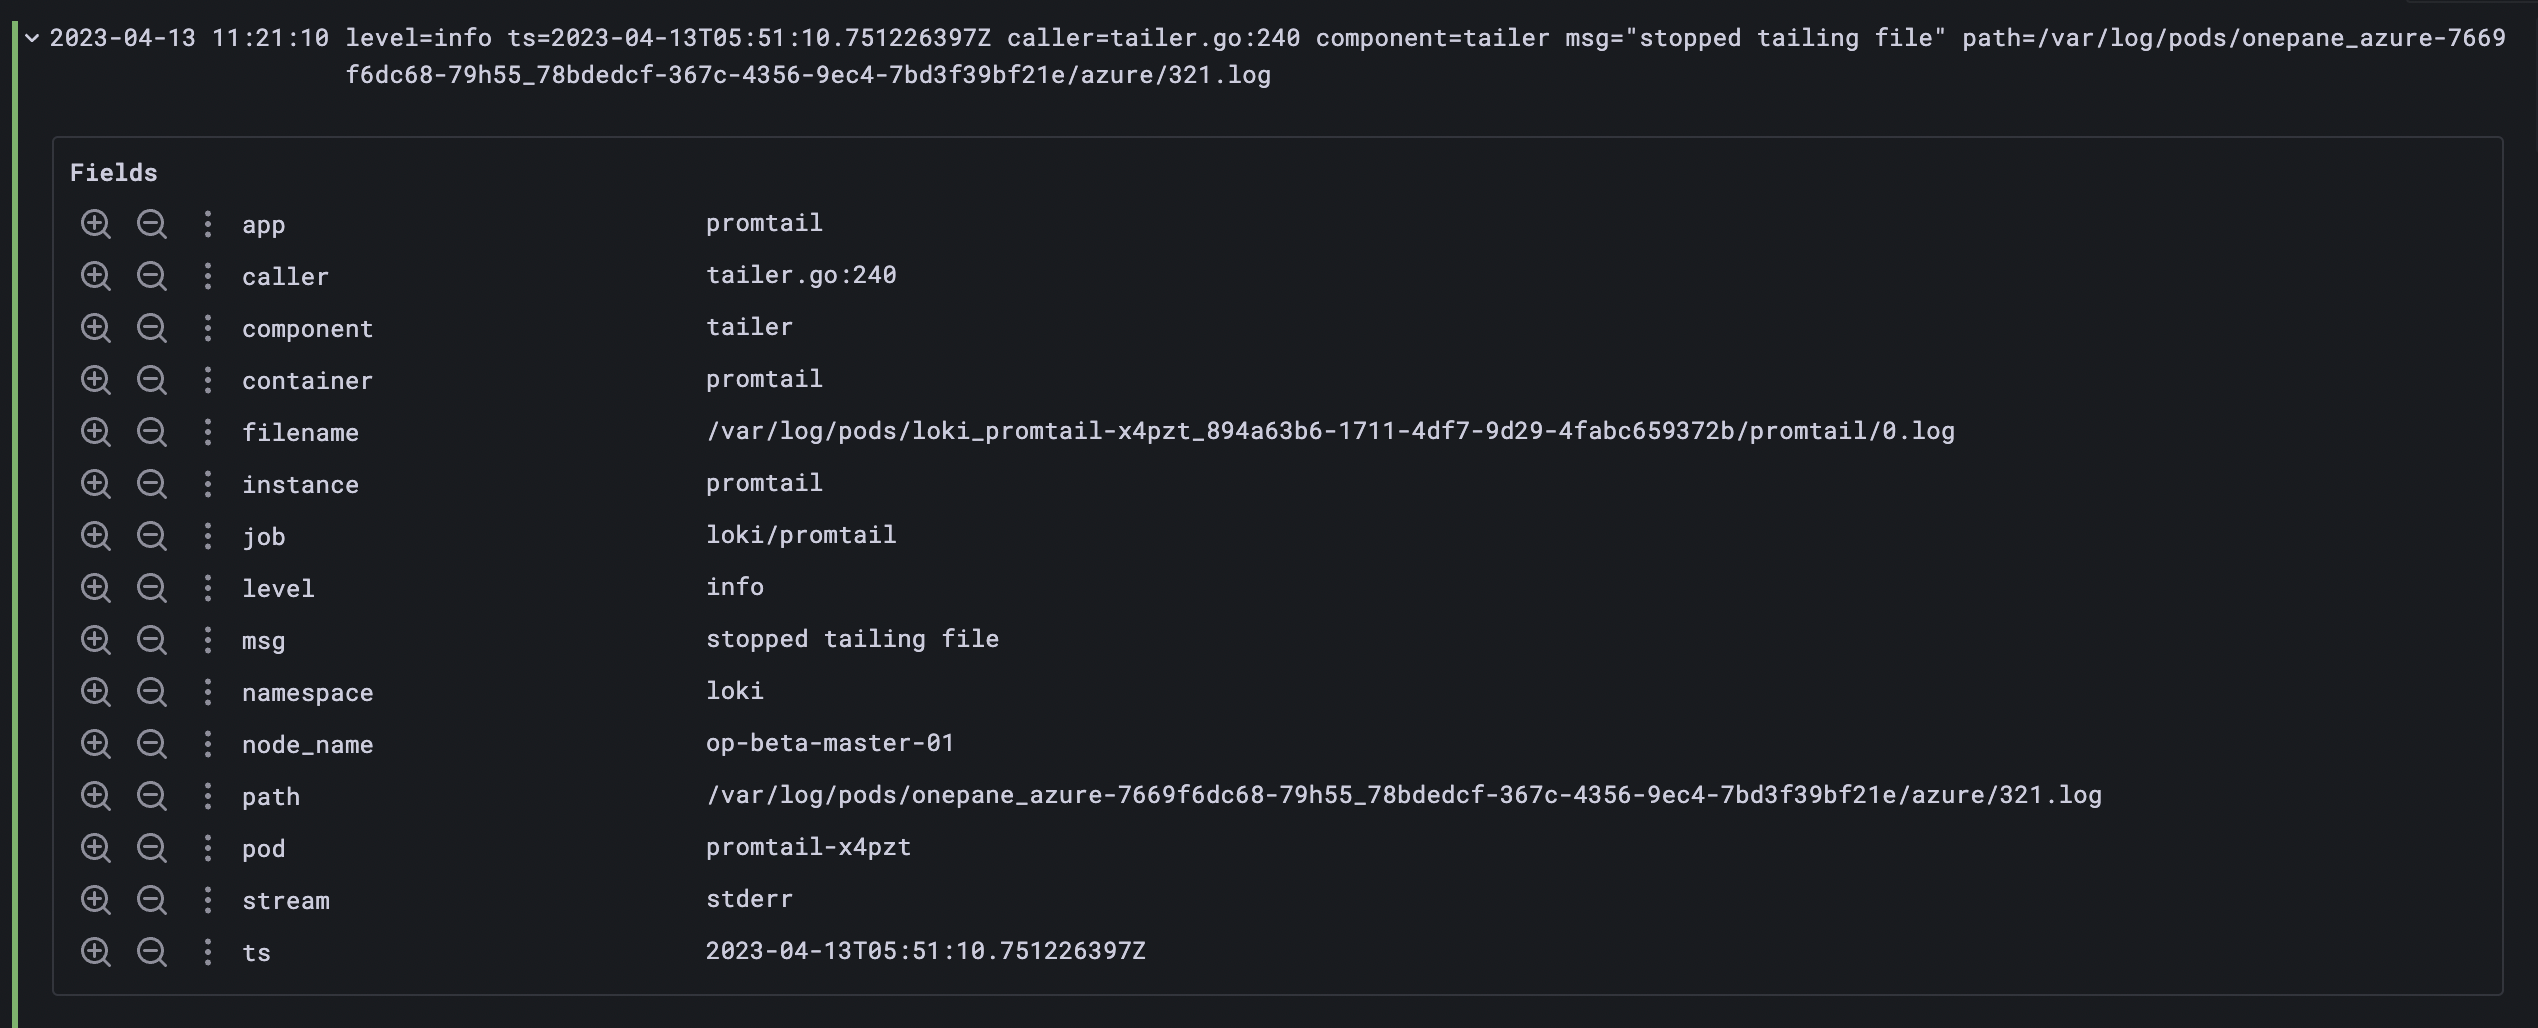
Adding `| logfmt to your pipeline will extract logs in logfmt ( a format in which key=value pairs separated by space "a=b c=d e=f") format. for instance, we can take promtail logs which are in logfmt format
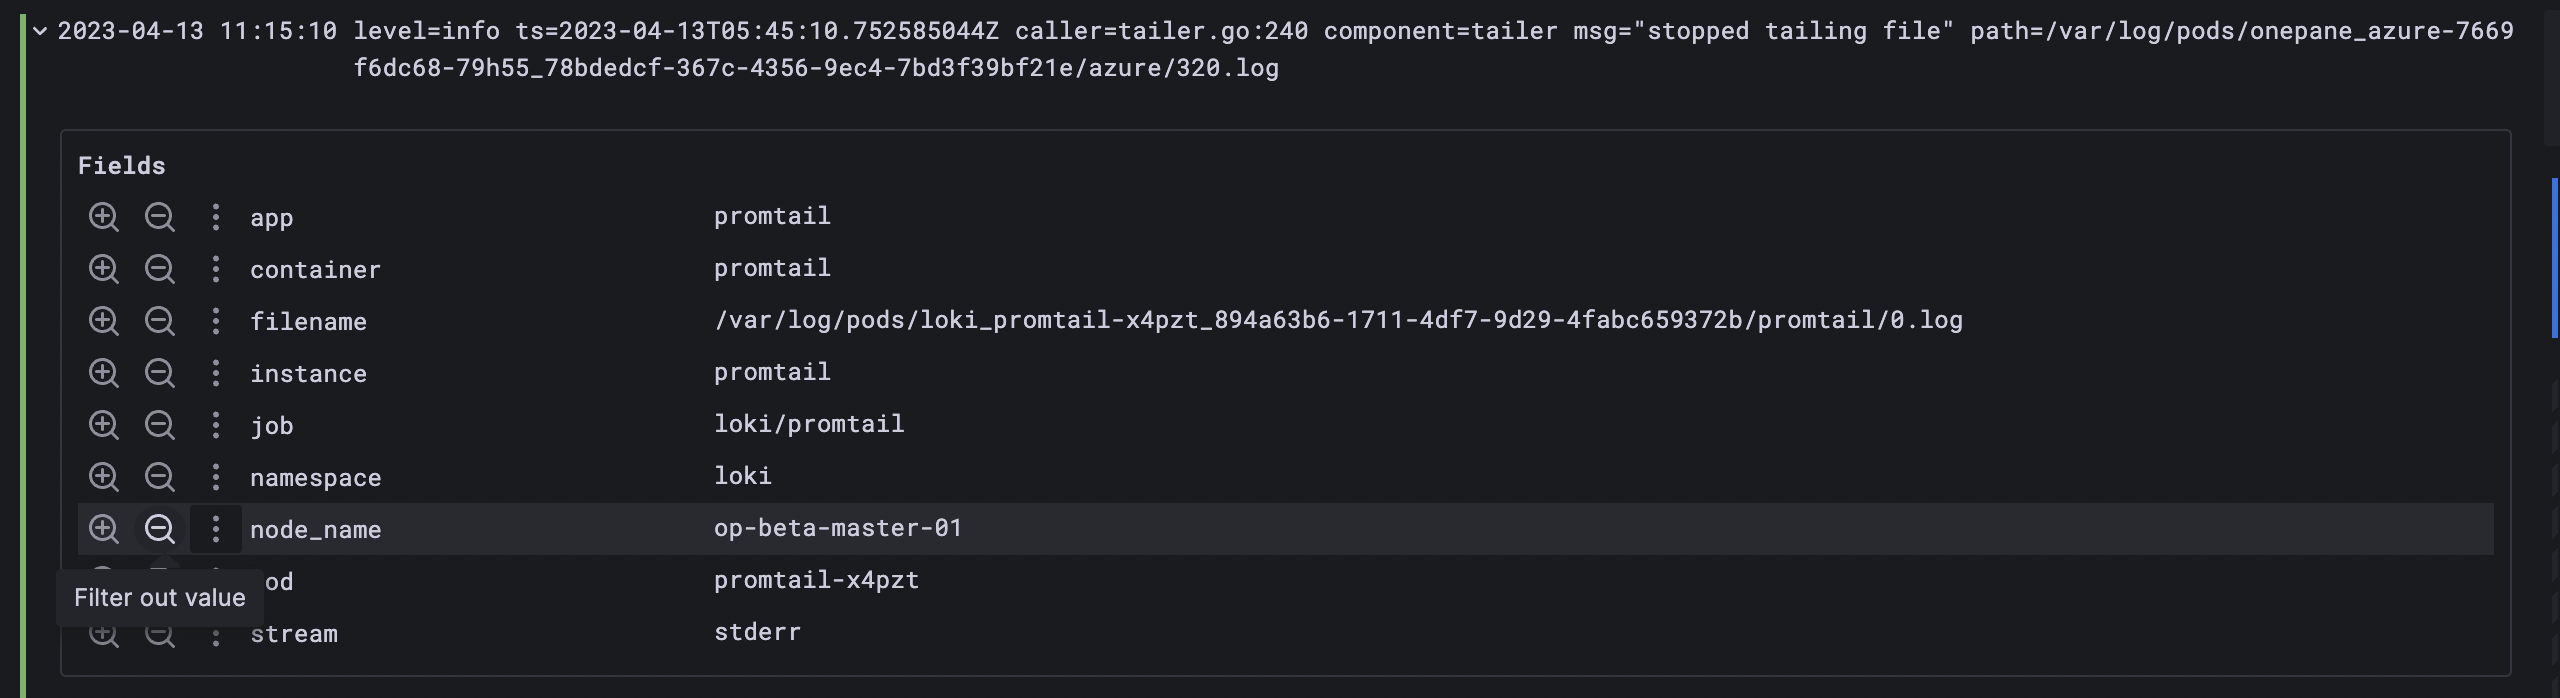
{ app = "promtail" } | logfmt this query will result in
3. Pattern
The pattern parser allows the explicit extraction of fields from log lines by defining a pattern expression
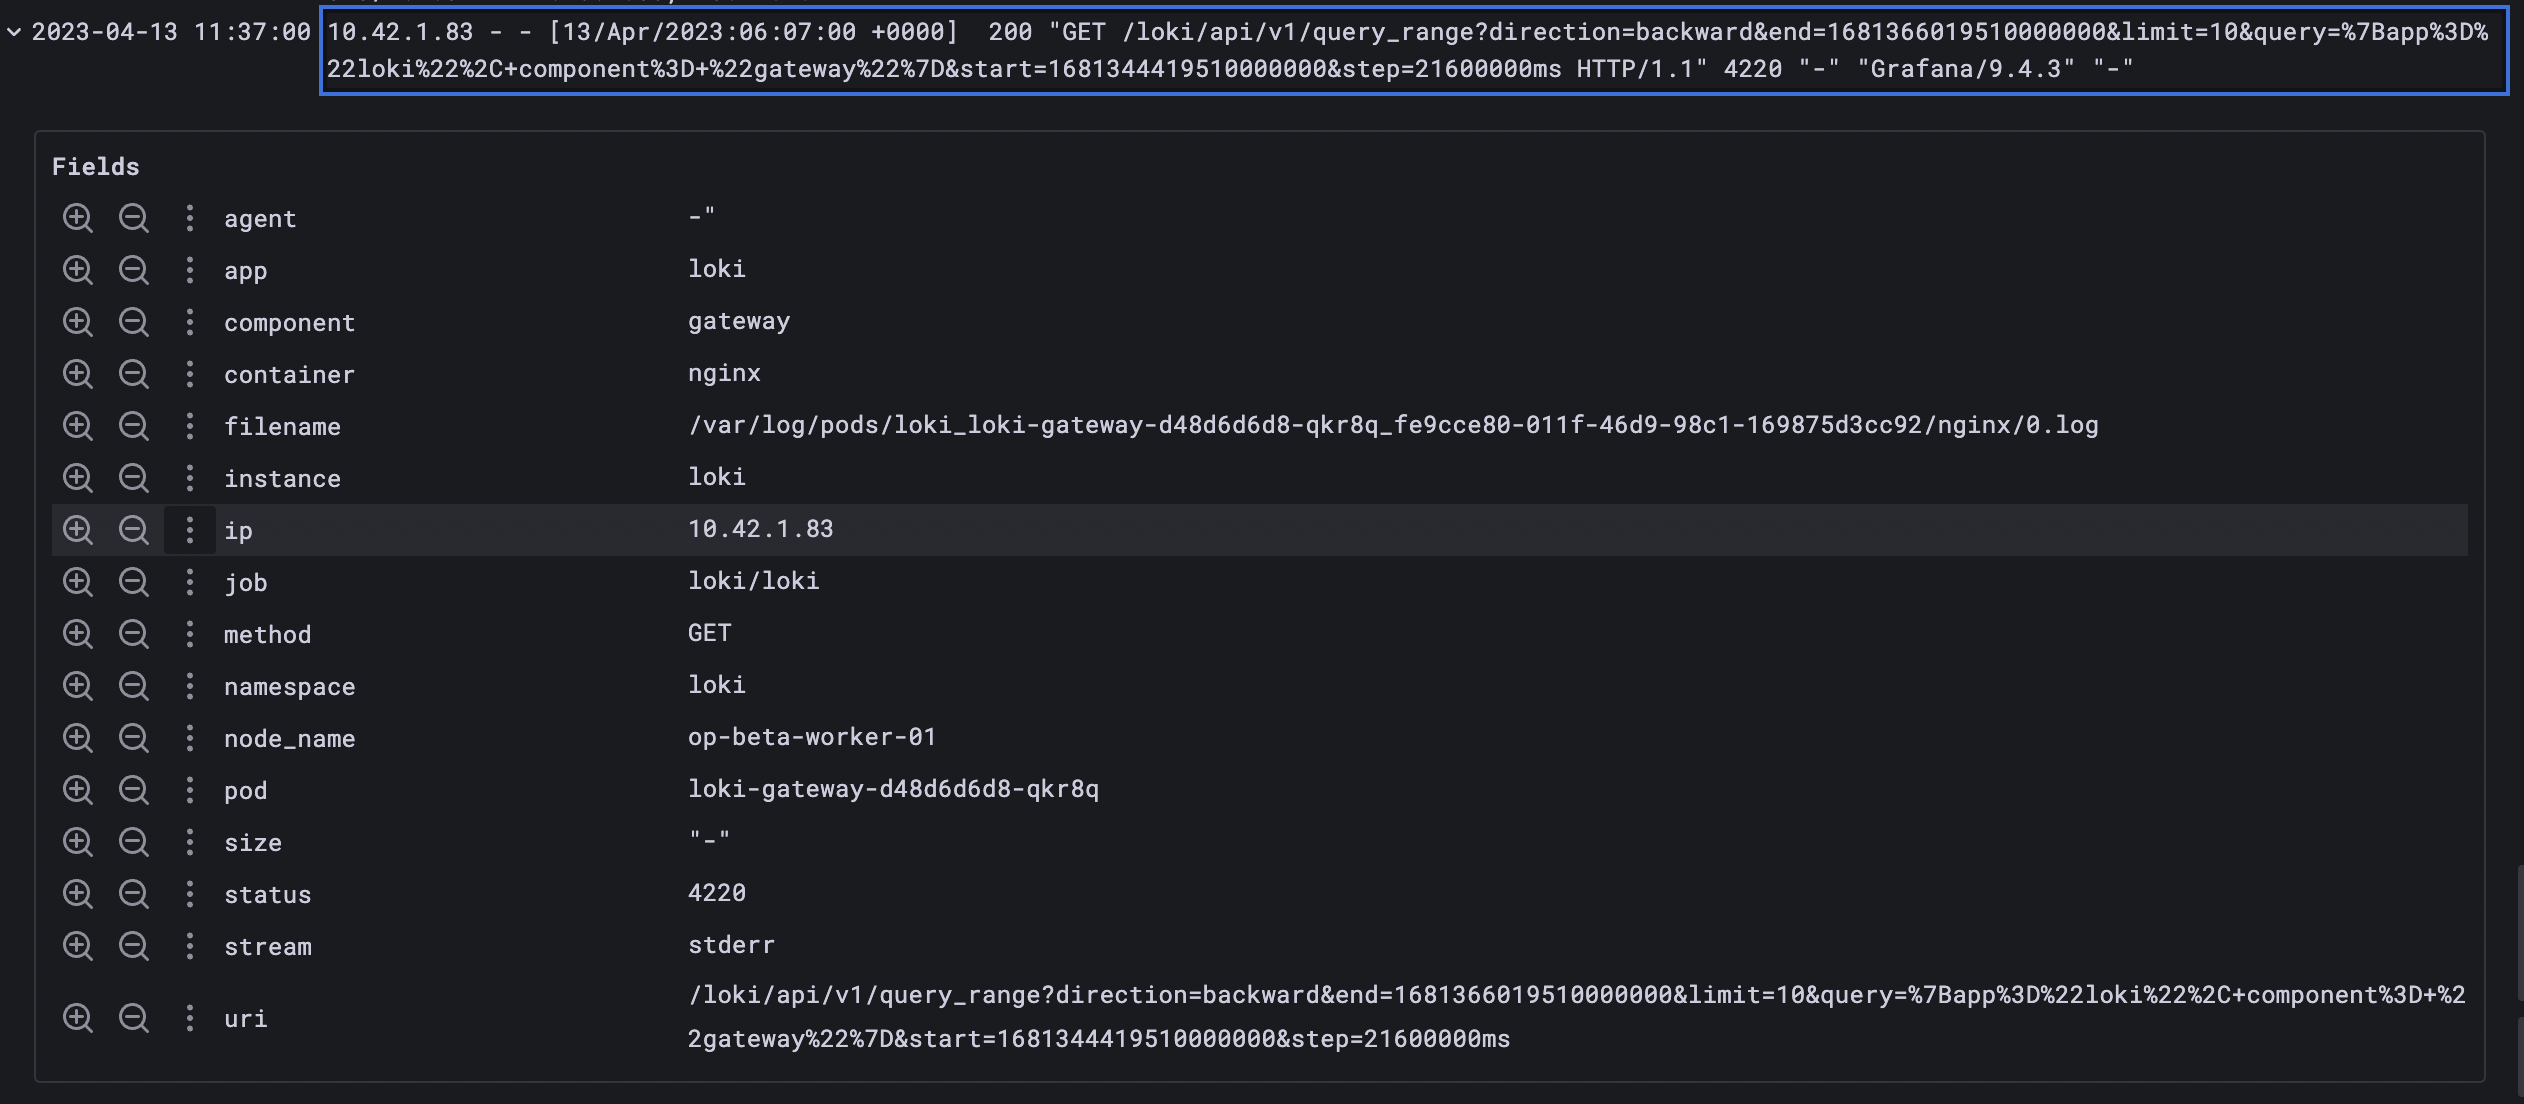
| pattern "<pattern-expression>"For instance, we can take a look at Loki gateway logs by executing the query below{app="loki", component= "gateway"}
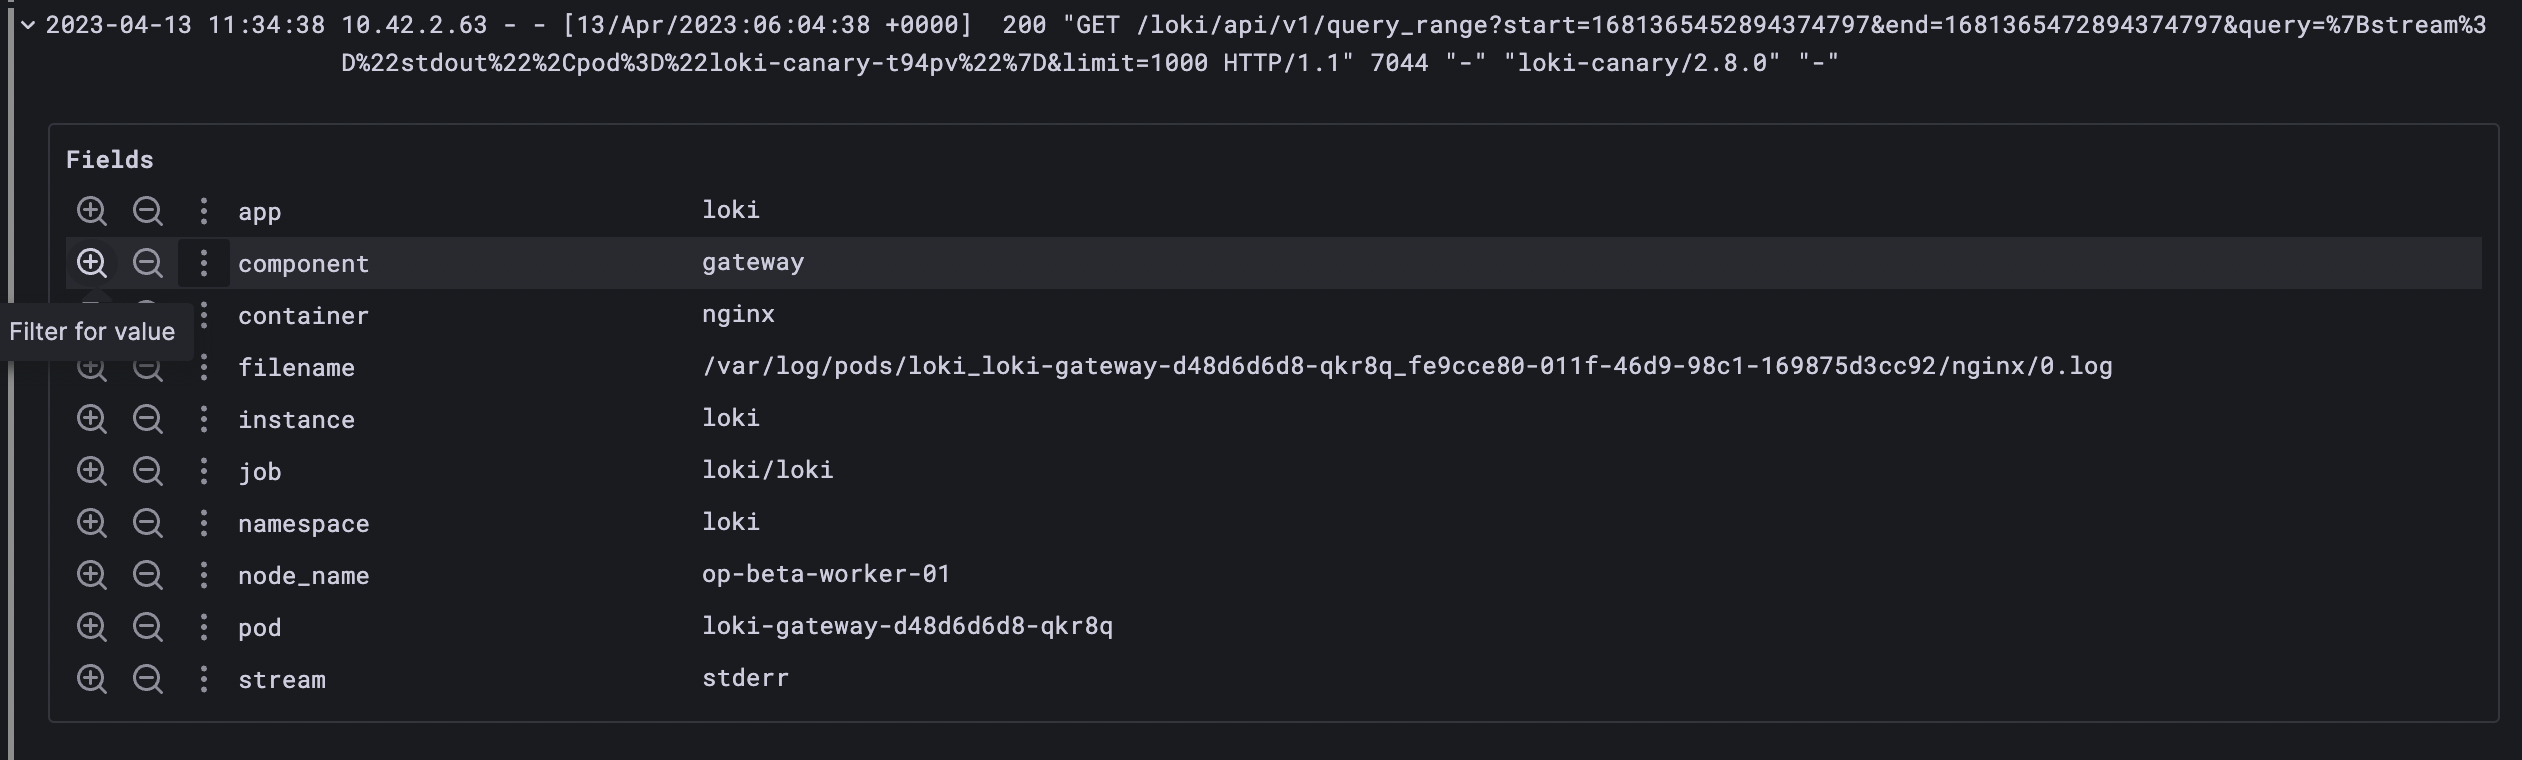
The log is in a constant format and we can parse the request details from the log using a pattern
<ip> - - [<datetime>] <status> "<method> <uri> <_>" <size> <_> "<agent>" <_>
let's use this in the query
{app="loki", component="gateway"}|pattern`<ip> - - [<datetime>] <status> "<method> <uri> <_>" <size> <_> "<agent>" <_>`this query will result in the following labels
4. Regexp
regexp is similar to pattern but rather than structure in this parser we can specify re2 regex for parsing each block. the regexp parser syntax is | regexp "<re>" in which 're' is the regular expression in Golang re2 format.
At least one named sub-match must be present in the regular expression
For example; "(?P<name>re)";
This named sub-match matches the label name with regex 're'. each named sub-match will extract a distinct label.
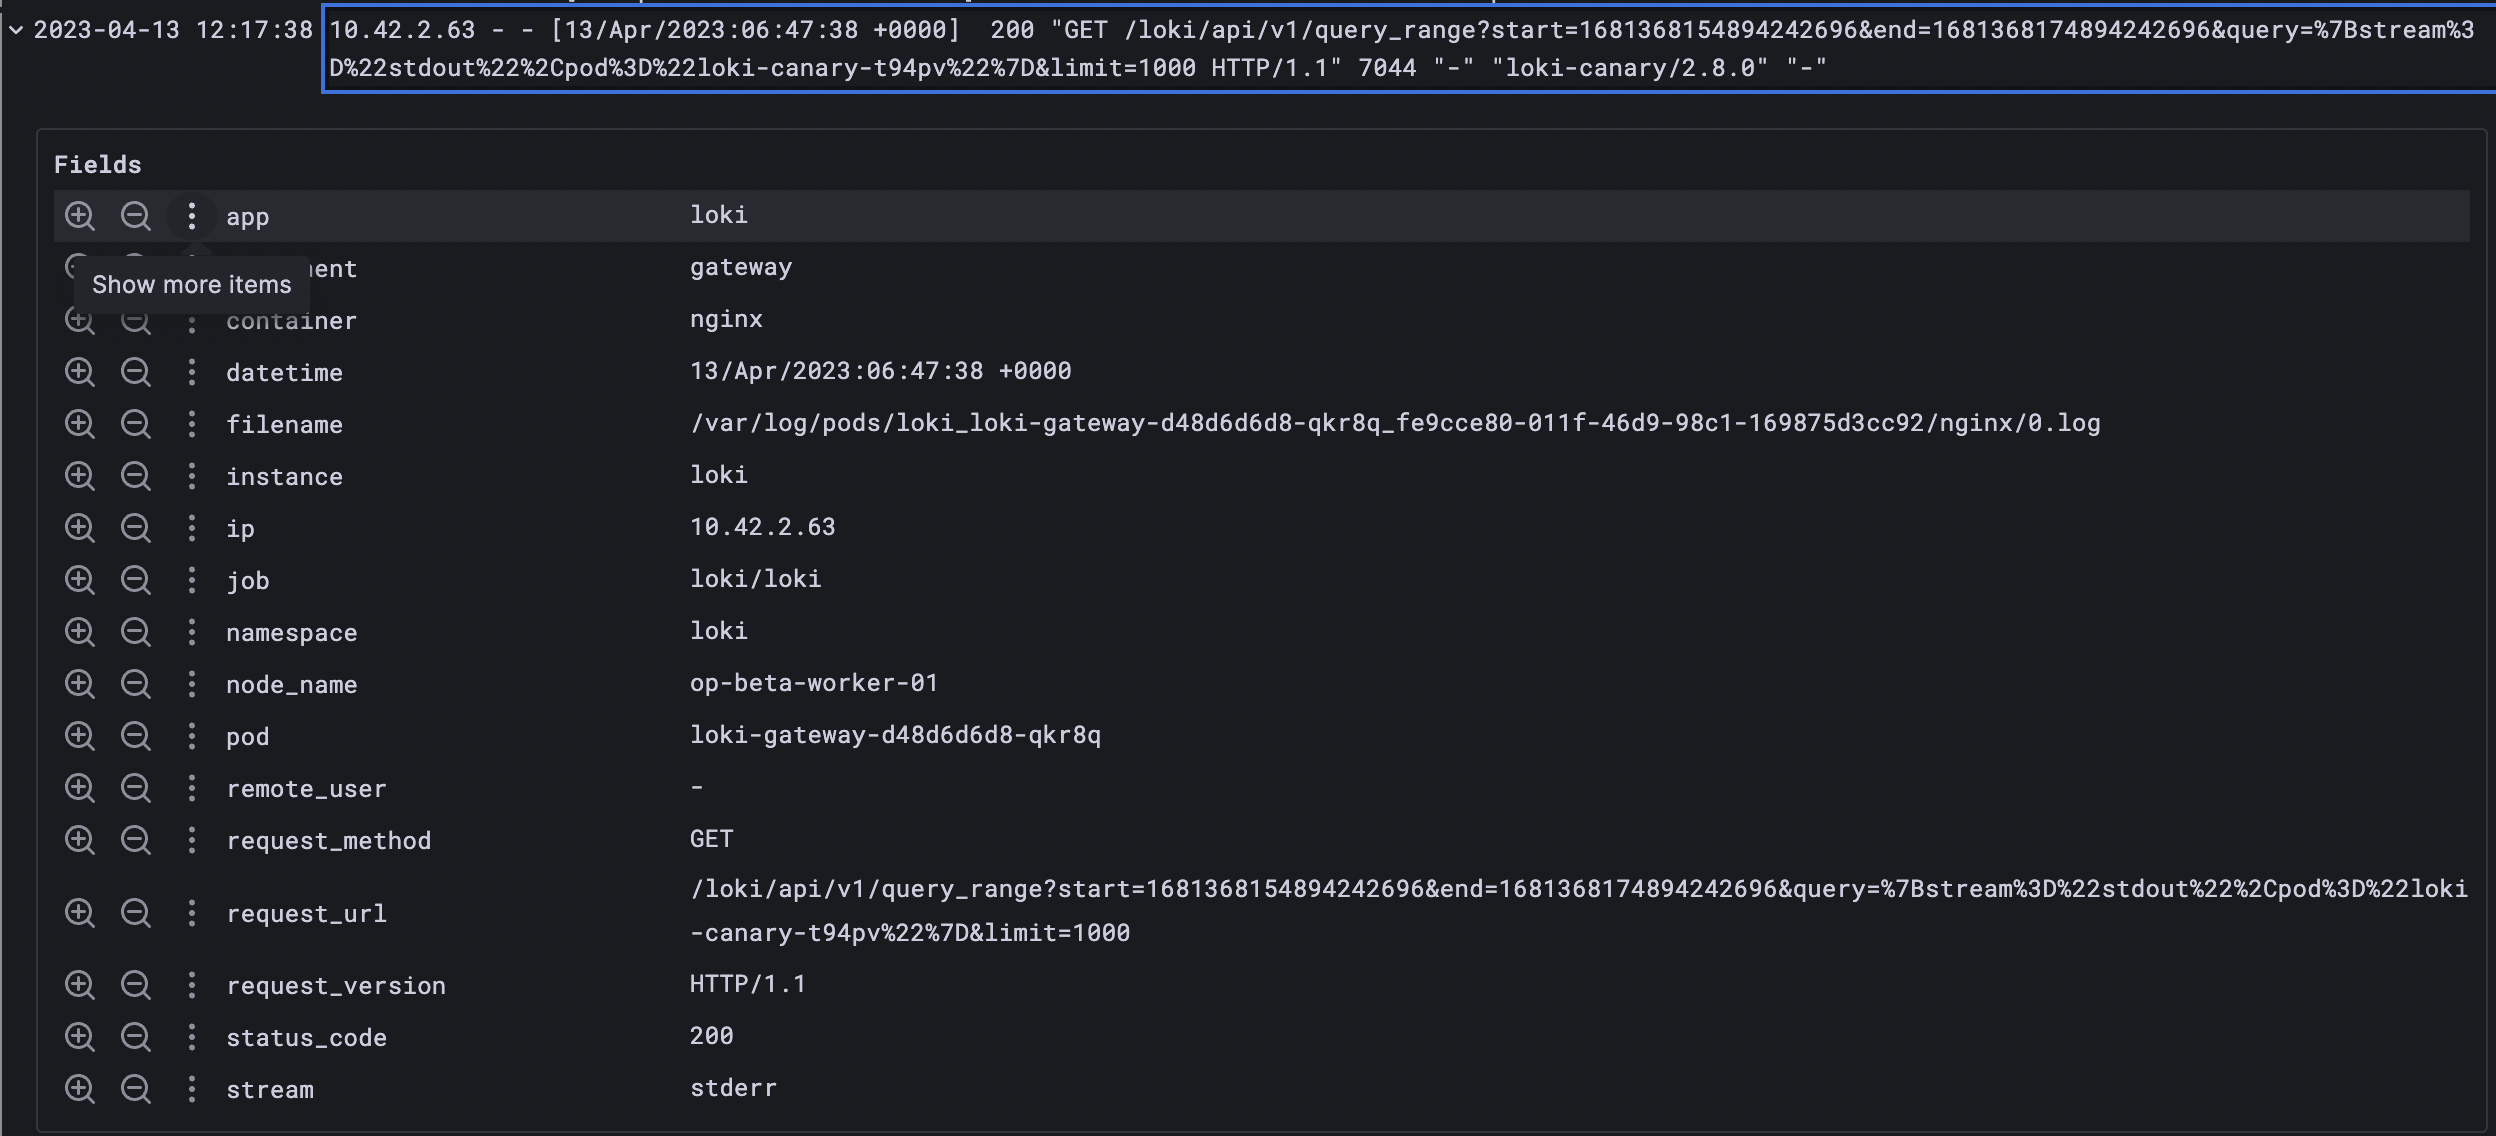
we can take the same gateway log used for the parser
The re2 regex for parsing the log is
(?P<ip>[\-\da-f.:, ]+) - (?P<remote_user>\S+) \[(?P<datetime>[^\]]+)\] (?P<status_code>\S+) "(?P<request_method>\S+) (?P<request_url>\S+) (?P<request_version>[\w\/\.]+)"
let's try this in query{app="loki", component="gateway"} | regexp `(?P<ip>[\-\da-f.:, ]+) - (?P<remote_user>\S+) \[(?P<datetime>[^\]]+)\] (?P<status_code>\S+) "(?P<request_method>\S+) (?P<request_url>\S+) (?P<request_version>[\w\/\.]+)"`
this query will result in
5. Unpack
Unpacking all embedded labels from Promtail's pack stage, the 'unpack' parser parses a JSON log line.
Whether you're just starting your journey with LogQL or seeking to expand your existing knowledge, this blog post will equip you with the necessary tools and knowledge to take full advantage of this powerful query language. Stay tuned for Part 2, where we'll explore more expressions of LogQL and delve deeper into its capabilities.