Observability
Getting started with LogQL Part 2: Filtering and Formating expressions
Explore the strong features of filtering and formatting expressions as you learn more about LogQL.
Getting started with LogQL Part 1: Basic Pipeline and Parsing expressions
We will look at LogQL queries with examples in this article in order to gain an understanding of how they operate and how they can be applied to log analysis.
Getting started with Grafana loki
Grafana Loki: A revolutionary logging system that simplifies log handling, reduces costs, and enables faster searching by indexing metadata and storing compressed log chunks in object stores like S3 or GCS
Deploy Prometheus using Kubernetes Operator part-2
In this blog, we explore the usage of Prometheus and Grafana for monitoring applications and Kubernetes clusters. Prometheus metrics are retrieved using PromQL, and key components like Node Exporter, Alert Manager, and PushGateway are introduced
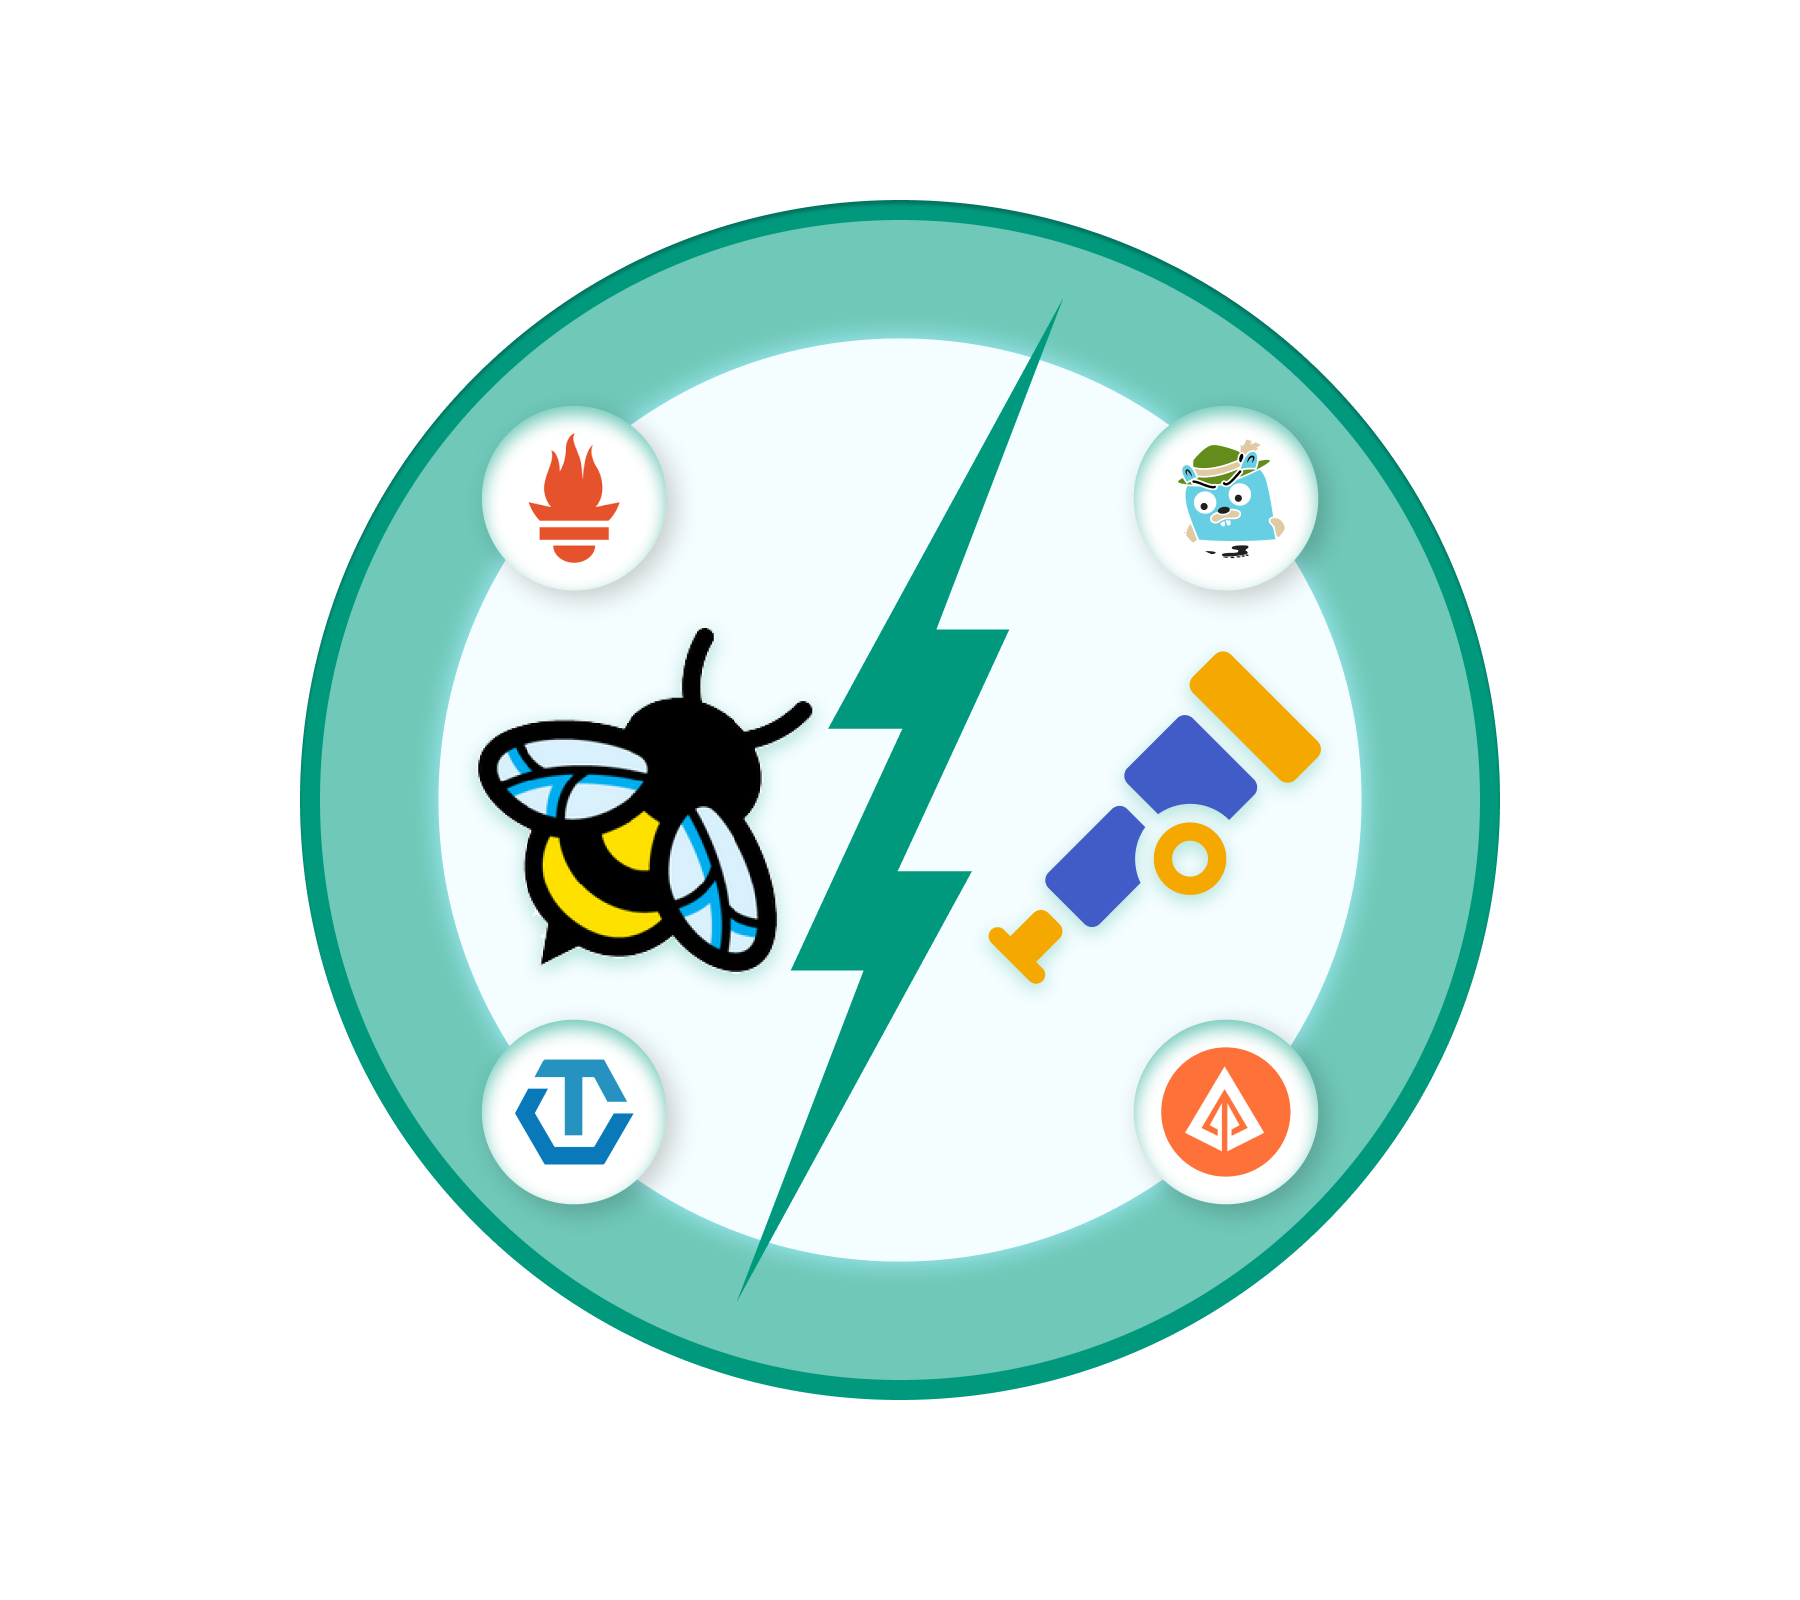
Unlocking Insights: Comparing eBPF and OpenTelemetry for Observability
eBPF and OpenTelemetry both are powerful tools built with different approaches having distinct advantages. So I believe eBPF will not replace OpenTelemetry or other existing solutions. Instead, it complements them. Let's discuss how.
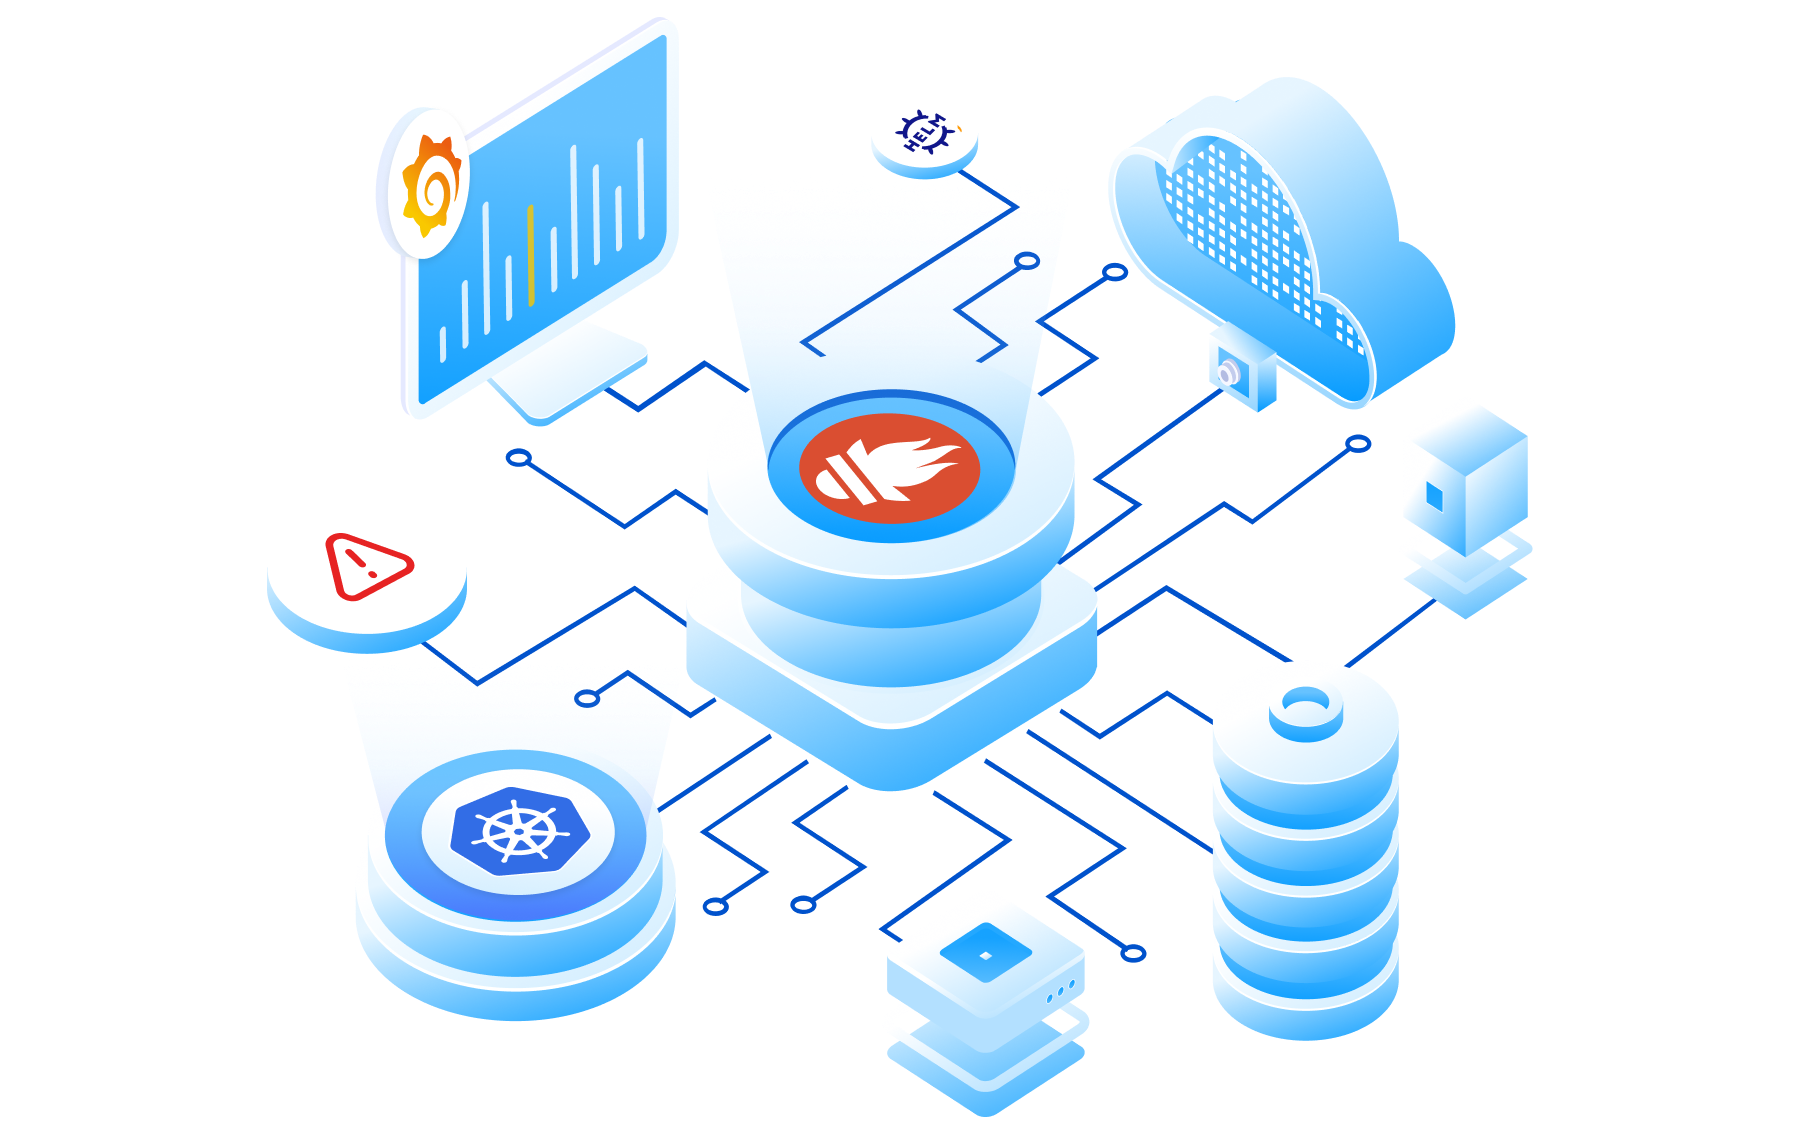
Deploy Prometheus using Kubernetes Operator
Prometheus is an open-source time-series database for storing metrics of Systems and Applications. Prometheus saves data in the format of metrics and query them in different ways for creating dashboards and Alerts